
Mathematics, 27.06.2020 21:01 dbailey6190
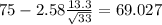
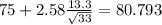
Suppose that textbook weights are normally distributed. You measure 33 textbooks' weights, and find they have a mean weight of 75 ounces. Assume the population standard deviation is 13.3 ounces. Based on this, construct a 99% confidence interval for the true population mean textbook weight. Round answers to 2 decimal places.

Answers: 2
 represent the sample mean
  population mean (variable of interest)
 represent the population standard deviation
 (1)
(1)

 and
and  , the critical value for this case would be


Another question on Mathematics
Mathematics, 21.06.2019 21:50
What is the next step in the given proof? choose the most logical approach. a. statement: m 1 + m 2 + 2(m 3) = 180° reason: angle addition b. statement: m 1 + m 3 = m 2 + m 3 reason: transitive property of equality c. statement: m 1 = m 2 reason: subtraction property of equality d. statement: m 1 + m 2 = m 2 + m 3 reason: substitution property of equality e. statement: 2(m 1) = m 2 + m 3 reason: substitution property of equality
Answers: 3
Mathematics, 22.06.2019 01:50
The length of time it takes to find a parking space at 9 a.m. follows a normal distribution with a mean of 5 minutes and a standard deviation of 2 minutes. find the probability that it takes at least 8 minutes to find a parking space. (round your answer to four decimal places.)
Answers: 1
Mathematics, 22.06.2019 02:30
Atrain traveled for 1.5 hours to the first station, stopped for 30 minutes, then traveled for 4 hours to the final station where it stopped for 1 hour. the total distance traveled is a function of time. which graph most accurately represents this scenario? a graph is shown with the x-axis labeled time (in hours) and the y-axis labeled total distance (in miles). the line begins at the origin and moves upward for 1.5 hours. the line then continues upward at a slow rate until 2 hours. from 2 to 6 hours, the line continues quickly upward. from 6 to 7 hours, it moves downward until it touches the x-axis a graph is shown with the axis labeled time (in hours) and the y axis labeled total distance (in miles). a line is shown beginning at the origin. the line moves upward until 1.5 hours, then is a horizontal line until 2 hours. the line moves quickly upward again until 6 hours, and then is horizontal until 7 hours a graph is shown with the axis labeled time (in hours) and the y-axis labeled total distance (in miles). the line begins at the y-axis where y equals 125. it is horizontal until 1.5 hours, then moves downward until 2 hours where it touches the x-axis. the line moves upward until 6 hours and then moves downward until 7 hours where it touches the x-axis a graph is shown with the axis labeled time (in hours) and the y-axis labeled total distance (in miles). the line begins at y equals 125 and is horizontal for 1.5 hours. the line moves downward until 2 hours, then back up until 5.5 hours. the line is horizontal from 5.5 to 7 hours
Answers: 1
Mathematics, 22.06.2019 05:30
How can you write the expression with a rationalized denominator? 5−√2 √3
Answers: 1
You know the right answer?
Suppose that textbook weights are normally distributed. You measure 33 textbooks' weights, and find...
Questions


Mathematics, 07.01.2021 17:40

Mathematics, 07.01.2021 17:40
Mathematics, 07.01.2021 17:40


Mathematics, 07.01.2021 17:40
Mathematics, 07.01.2021 17:40
English, 07.01.2021 17:40

Mathematics, 07.01.2021 17:40
Mathematics, 07.01.2021 17:40


