
Mathematics, 27.06.2020 07:01 PoPFli21
HELP
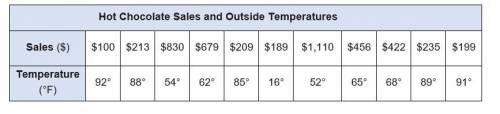
Step 1: Constructing and analyzing scatterplots You keep track of the daily hot chocolate sales and the outside temperature each day. The data you gathered is shown in the data table below. Hot Chocolate Sales and Outside Temperatures Sales ($) $100 $213 $830 $679 $209 $189 $1,110 $456 $422 $235 $199 Temperature (°F) 92° 88° 54° 62° 85° 16° 52° 65° 68° 89° 91° a)
Make a scatterplot of the data above. (2 points) b) Do you notice clusters or outliers in the data?
Explain your reasoning. (2 points) c) How would you describe the correlation in the data?
Explain your reasoning. (2 points)
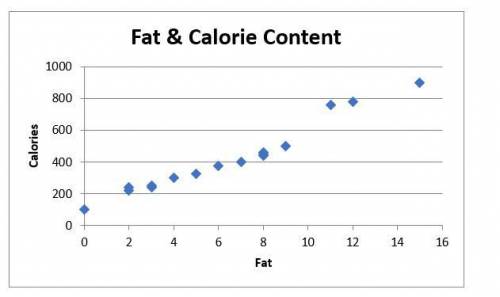
d) What are the independent and dependent variables? (2 points) Step 2: Evaluating trends of data Because you want to prepare and serve the healthiest food possible, you monitor the fat and calorie content of items on your menu. Some of the menu items are included in the graph below.
a) Your business partner describes this as a high positive correlation. Is your partner correct? Why or why not? (2 points)
b) Using the drawing tools, draw a trend line (line of best fit) on the graph above. (2 points)
c) Judge the closeness of your trend line to the data points. Do you notice a relationship between the data points? (2 points)
d) Is the trend line linear? If so, write a linear equation that represents the trend line. Show your work. (3 points)
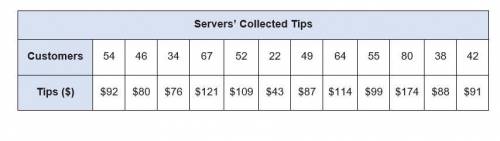
Step 3: Making predictions using data You and your business partner track the number of customers served and the amount of tips collected per day. The data you gathered is displayed in the chart below. Servers’ Collected Tips Customers 54 46 34 67 52 22 49 64 55 80 38 42 Tips ($) $92 $80 $76 $121 $109 $43 $87 $114 $99 $174 $88 $91 a) Create a scatterplot displaying the data in the table. Be sure to include a linear trend line. (2 points)
b) Find the equation of the trend line (line of best fit). Show your work. (2 points)
c) Predict the amount of tips that would be collected if 100 customers were served at the restaurant on a given day. Explain your reasoning. d) Explain how to use the regression calculator to make a reasonable prediction given a data table.

Answers: 1


Another question on Mathematics
Mathematics, 21.06.2019 20:40
Which questions would most a reader identify the author's purpose for writing? check all that apply. what type of text is this? what type of reviews did the book receive? how many copies of the book have been sold? what is the central idea? how does this text make one feel?
Answers: 2
Mathematics, 22.06.2019 00:00
What is 617.3 miles and each gallon of gas the car can travel 41 miles select a reasonable estimate of the number of gallons of gas karl used.
Answers: 1
Mathematics, 22.06.2019 01:00
Exclude leap years from the following calculations. (a) compute the probability that a randomly selected person does not have a birthday on october 4. (type an integer or a decimal rounded to three decimal places as needed.) (b) compute the probability that a randomly selected person does not have a birthday on the 1st day of a month. (type an integer or a decimal rounded to three decimal places as needed.) (c) compute the probability that a randomly selected person does not have a birthday on the 30th day of a month. (type an integer or a decimal rounded to three decimal places as needed.) (d) compute the probability that a randomly selected person was not born in january. (type an integer or a decimal rounded to three decimal places as needed.)
Answers: 1
Mathematics, 22.06.2019 01:10
Evaluate 8x2 + 9x − 1 2x3 + 3x2 − 2x dx. solution since the degree of the numerator is less than the degree of the denominator, we don't need to divide. we factor the denominator as 2x3 + 3x2 − 2x = x(2x2 + 3x − 2) = x(2x − 1)(x + 2). since the denominator has three distinct linear factors, the partial fraction decomposition of the integrand has the form† 8x2 + 9x − 1 x(2x − 1)(x + 2) = correct: your answer is correct. to determine the values of a, b, and c, we multiply both sides of this equation by the product of the denominators, x(2x − 1)(x + 2), obtaining 8x2 + 9x − 1 = a correct: your answer is correct. (x + 2) + bx(x + 2) + cx(2x − 1).
Answers: 3
You know the right answer?
HELP
Step 1: Constructing and analyzing scatterplots You keep track of the daily hot chocolate sale...
Questions


Computers and Technology, 09.10.2019 16:10

Chemistry, 09.10.2019 16:10

Mathematics, 09.10.2019 16:10

Health, 09.10.2019 16:10
Social Studies, 09.10.2019 16:10
Mathematics, 09.10.2019 16:10
Mathematics, 09.10.2019 16:10


