
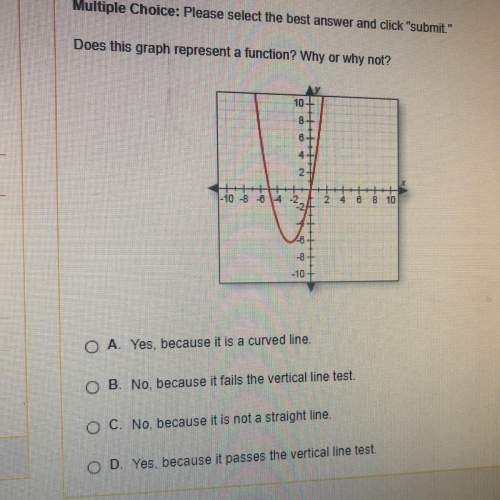
Mathematics, 26.06.2020 23:01 daniecott
The chart below shows the distribution of the number of books in a library. A circle graph titled Types of Books. The largest proportion is Literature, then Fantasy, then non-fiction, then children's. Sahira chooses a random sample from the library and records the type of books in the chart below. Type of Book Number Fantasy 10 Literature 25 Children’s 4 Nonfiction 11 Which explains whether or not Sahira’s sample is representative?

Answers: 2


Another question on Mathematics
Mathematics, 21.06.2019 17:00
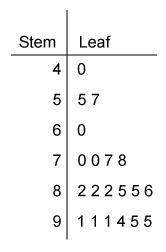
100 points, hi, i’m not sure what to do here,the data doesn’t seem to be quadratic .? can anyone me, in advance
Answers: 2
Mathematics, 21.06.2019 19:00
Aprojectile is thrown upward so that its distance above the ground after t seconds is given by the function h(t) = -16t2 + 704t. after how many seconds does the projectile take to reach its maximum height?
Answers: 1
Mathematics, 21.06.2019 21:30
Consider a bag that contains 220 coins of which 6 are rare indian pennies. for the given pair of events a and b, complete parts (a) and (b) below. a: when one of the 220 coins is randomly selected, it is one of the 6 indian pennies. b: when another one of the 220 coins is randomly selected (with replacement), it is also one of the 6 indian pennies. a. determine whether events a and b are independent or dependent. b. find p(a and b), the probability that events a and b both occur.
Answers: 2
Mathematics, 21.06.2019 21:30
The price of a dozen eggs was $1.63. suppose the price increases m dollars per dozen and then the price decreases $0.12 per dozen. which expression represents the current price of eggs after the two price changes?
Answers: 1
You know the right answer?
The chart below shows the distribution of the number of books in a library. A circle graph titled Ty...
Questions

Mathematics, 30.03.2021 23:00


Physics, 30.03.2021 23:00
Mathematics, 30.03.2021 23:00
Mathematics, 30.03.2021 23:00

History, 30.03.2021 23:00


Health, 30.03.2021 23:00
Mathematics, 30.03.2021 23:00


