
Mathematics, 21.06.2020 03:57 zachtsmith2001
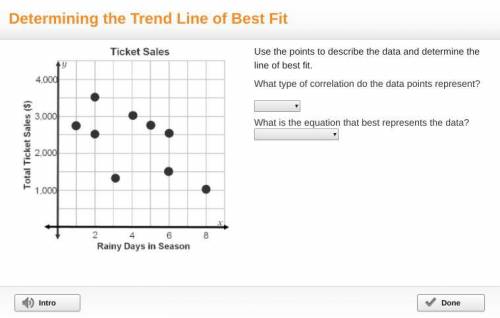
Please help! A graph titled ticket sales has rainy days in season on the x-axis and total ticket sales (dollars) on the y-axis. Points are grouped together and decrease. Points are at (1, 2,800), (2, 2,500), (2, 3,500), (3, 1,400), (4, 3,000), (5, 2,800), (6, 1,500), (6, 2,500), and (8, 1,000). Use the points to describe the data and determine the line of best fit. What type of correlation do the data points represent? What is the equation that best represents the data?

Answers: 2


Another question on Mathematics
Mathematics, 21.06.2019 13:00
Sal is tiling his entryway. the floor plan is drawn on a unit grid. each unit length represents 1 foot. tile costs $1.35 per square foot. how much will sal pay to tile his entryway? round your answer to the nearest cent.
Answers: 2
Mathematics, 21.06.2019 16:10
Pls! does anybody know a shortcut for answering these types of questions in the future?
Answers: 3
Mathematics, 21.06.2019 19:30
Show your workcan a right triangle have this sides? *how to prove it without using the pythagorean theorema*
Answers: 2
Mathematics, 21.06.2019 22:30
For the chance to be team captain, the numbers 1-30 are put in a hat and you get two chances to pick a number, without replacement. which formula correctly shows how to find the probability that you choose the number 1 and then 2?
Answers: 1
You know the right answer?
Please help! A graph titled ticket sales has rainy days in season on the x-axis and total ticket sal...
Questions
Mathematics, 18.04.2020 06:21

Mathematics, 18.04.2020 06:21

History, 18.04.2020 06:21


Mathematics, 18.04.2020 06:37
Mathematics, 18.04.2020 06:37
History, 18.04.2020 06:37
History, 18.04.2020 06:37
History, 18.04.2020 06:38
Mathematics, 18.04.2020 06:38
History, 18.04.2020 06:38


