
Mathematics, 07.06.2020 02:59 samanthacruzsc51
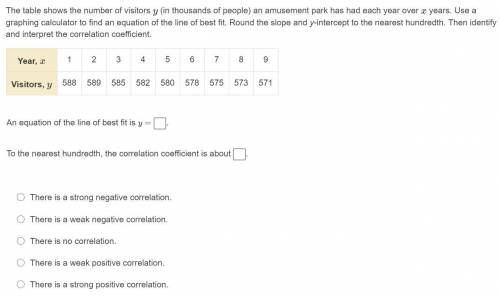
The table shows the number of visitors y (in thousands of people) an amusement park has had each year over x years. Use a graphing calculator to find an equation of the line of best fit. Round the slope and y-intercept to the nearest hundredth. Then identify and interpret the correlation coefficient.

Answers: 3


Another question on Mathematics
Mathematics, 21.06.2019 20:00
Which sums are equal to 1hold 6/8? choose all answers that are correcta.1/8+6/8b.12/8+2/8c.8/8+1/8+1/8+1/8+1/8+1/8+1/8d.8/8+6/8
Answers: 1
Mathematics, 21.06.2019 21:00
The sum of the first eight terms of an arithmetic progression is 9m + 14. the fifth term of the06 progression is 2m - 6, where m is a constant.given that the first term of the progression is 26,find the value of the common difference, d and thevalue of m.
Answers: 1
Mathematics, 22.06.2019 00:00
Table of values relation g values x, y 2,2 /3,5 /4,9 /5,13 which ordered pair is in g inverse? a(-2,2) b(-3,-5) c)4,9) d( 13,5)
Answers: 3
You know the right answer?
The table shows the number of visitors y (in thousands of people) an amusement park has had each yea...
Questions

English, 24.11.2019 06:31

Mathematics, 24.11.2019 06:31
Mathematics, 24.11.2019 06:31
Social Studies, 24.11.2019 06:31
Mathematics, 24.11.2019 06:31

Spanish, 24.11.2019 06:31
Mathematics, 24.11.2019 06:31
Mathematics, 24.11.2019 06:31
Mathematics, 24.11.2019 06:31
Mathematics, 24.11.2019 06:31
Mathematics, 24.11.2019 06:31

Geography, 24.11.2019 06:31

Chemistry, 24.11.2019 06:31

History, 24.11.2019 06:31
Geography, 24.11.2019 06:31

Health, 24.11.2019 06:31


