
Mathematics, 02.06.2020 02:57 Queenhagar
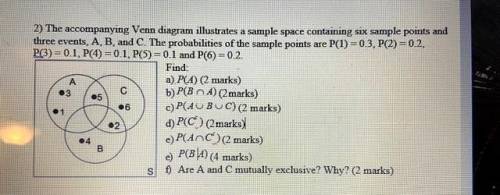
The accompanying Venn diagram illustrates a sample space containing six sample points and three events, A, B, and C. The probabilities of the sample points are P(1) = 0.3, P(2) = 0.2, P(3) = 0.1, P(4) = 0.1, P(5) = 0.1 and P(6) = 0.2.
Find:

Answers: 3
 . This set has no points in it, so its probability is 0.
  . P(C) is the probability by summing 5,6,2 so P(C) = 0.5. So
 That is, all the points that are in A but not in C. So add 1,3. Then the probability is 0.4
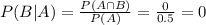 , using the definition of conditional probabily and results a,b.
  is the probability of 5, that is 0.1. Since 0.1>0, they are not mutually exclusive.

Another question on Mathematics
Mathematics, 21.06.2019 18:00
Which shows the correct lengths of side c in both scales? scale 1: 45 m; scale 2: 60 m scale 1: 60 m; scale 2: 45 m scale 1: 36 m; scale 2: 27 m scale 1: 27 m; scale 2: 36 m mark this and return save and exit
Answers: 3
Mathematics, 21.06.2019 18:00
What is the relationship between all triangles that can be drawn given the same three angles
Answers: 2
You know the right answer?
The accompanying Venn diagram illustrates a sample space containing six sample points and three even...
Questions


Mathematics, 30.10.2020 16:50

Computers and Technology, 30.10.2020 16:50


