
Mathematics, 25.05.2020 21:57 celestemaria0727
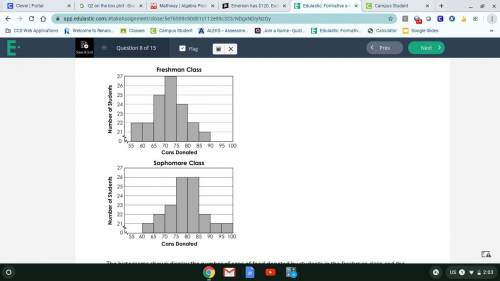
The histograms shown display the number of cans of food donated by students in the freshman class and the sophomore class at a school.
Which statement is true?
A. The freshman class has the same median number of cans donated as the sophomore class.
B. The freshman class has a greater mean number of cans donated than the sophomore class.
C. The freshman class has a lesser mean number of cans donated than the sophomore class.
D. The freshman class has a greater median number of cans donated than the sophomore class.

Answers: 3


Another question on Mathematics
Mathematics, 21.06.2019 22:30
Assume that y varies inversely with x. if y=1.6 when x=0.5 find x when y=3.2
Answers: 1
Mathematics, 22.06.2019 01:00
Mia’s gross pay is 2953 her deductions total 724.15 what percent if her gross pay is take-home pay
Answers: 1
Mathematics, 22.06.2019 02:10
Overproduction of uric acid in the body can be an indication of cell breakdown. this may be an advance indication of illness such as gout, leukemia, or lymphoma.† over a period of months, an adult male patient has taken nine blood tests for uric acid. the mean concentration was x = 5.35 mg/dl. the distribution of uric acid in healthy adult males can be assumed to be normal, with σ = 1.87 mg/dl. (a) find a 95% confidence interval for the population mean concentration of uric acid in this patient's blood. what is the margin of error? (round your answers to two decimal places.) lower limit upper limit margin of error (b) what conditions are necessary for your calculations? (select all that apply.) σ is unknown n is large σ is known normal distribution of uric acid uniform distribution of uric acid (c) interpret your results in the context of this problem. there is not enough information to make an interpretation. the probability that this interval contains the true average uric acid level for this patient is 0.05. the probability that this interval contains the true average uric acid level for this patient is 0.95. there is a 95% chance that the confidence interval is one of the intervals containing the population average uric acid level for this patient. there is a 5% chance that the confidence interval is one of the intervals containing the population average uric acid level for this patient. (d) find the sample size necessary for a 95% confidence level with maximal margin of error e = 1.10 for the mean concentration of uric acid in this patient's blood. (round your answer up to the nearest whole number.) blood tests
Answers: 2
Mathematics, 22.06.2019 02:10
Triangle xyz, with vertices x(-2, 0), y(-2, -1), and z(-5, -2), undergoes a transformation to form triangle x′y′z′, with vertices x′(4, -2), y′(4, -3), and z′(1, -4). the type of transformation that triangle xyz undergoes is a . triangle x′y′z′ then undergoes a transformation to form triangle x′y′z′, with vertices x″(4, 2), y″(4, 3), and z″(1, 4). the type of transformation that triangle x′y′z′ undergoes is a .
Answers: 1
You know the right answer?
The histograms shown display the number of cans of food donated by students in the freshman class an...
Questions


