
Mathematics, 24.05.2020 02:02 soogy
A manager is assessing the correlation between the number of employees in a plant and the number of products produced yearly. The table shows the data:
Number of employees
(x) 0 25 50 75 100 125 150 175 200
Number of products
(y) 10 160 310 460 610 760 910 1060 1210
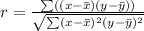
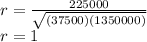
Part A: Is there any correlation between the number of employees in the plant and the number of products produced yearly? Justify your answer. (4 points)
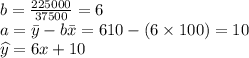
Part B: Write a function that best fits the data. (3 points)
Part C: What does the slope and y-intercept of the plot indicate? (3 points)

Answers: 1


Another question on Mathematics
Mathematics, 21.06.2019 14:50
Which equations represents circles that have a diameter of 12 units and a center that lies on the y-axis? check all that apply
Answers: 1
Mathematics, 21.06.2019 15:30
What is the domain and range of each function 1. x (3, 5, 7, 8, 11) y ( 6, 7, 7, 9, 14) 2. x (-3, -1, 2, 5, 7) y (9, 5, 4, -5, -7)
Answers: 2
Mathematics, 21.06.2019 20:30
For the quadratic function [tex]y=(x+4)^2-1[/tex] , do the following: a) rewrite the function in the standard form, b) rewrite the function in intercept form, c) find the vertex, d) find the y-intercept, e) find the x-intercepts.
Answers: 1
You know the right answer?
A manager is assessing the correlation between the number of employees in a plant and the number of...
Questions
SAT, 04.10.2021 02:40
Mathematics, 04.10.2021 02:40

English, 04.10.2021 02:40
Mathematics, 04.10.2021 02:40
English, 04.10.2021 02:40


Computers and Technology, 04.10.2021 02:40
Mathematics, 04.10.2021 02:40

Biology, 04.10.2021 02:40

World Languages, 04.10.2021 02:40


History, 04.10.2021 02:40
Mathematics, 04.10.2021 02:40
English, 04.10.2021 02:40
Mathematics, 04.10.2021 02:40
Mathematics, 04.10.2021 02:40


