 with the highest frequency 8
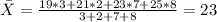
The table shows the age, in years, of employees in a company.
Age (a) in years Frequency
...

Mathematics, 23.05.2020 14:57 jasminellenaee
The table shows the age, in years, of employees in a company.
Age (a) in years Frequency
18 < a < 20
3
20 < a < 22
2
22 < a < 24
7
24 < a < 26
8
26 0
a) Find the modal class interval.
Isac
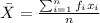
b) Work out an estimate of the mean age of these employees.

Answers: 3


Another question on Mathematics
Mathematics, 21.06.2019 17:00
Which graph corresponds to the function f(x) = x2 + 4x – 1?
Answers: 1
Mathematics, 21.06.2019 17:00
What is the difference between the points (4, 7) and (4, -5)? a. 0 units b. 2 units c. 4 units d. 12 units
Answers: 1
Mathematics, 21.06.2019 18:20
Inez has a phone card. the graph shows the number of minutes that remain on her phone card a certain number of days.
Answers: 2
Mathematics, 21.06.2019 18:50
Astudent draws two parabolas on graph paper. both parabolas cross the x-axis at (-4, 0) and (6,0). the y-intercept of thefirst parabola is (0, –12). the y-intercept of the second parabola is (0-24). what is the positive difference between the avalues for the two functions that describe the parabolas? write your answer as a decimal rounded to the nearest tenth.
Answers: 2
You know the right answer?
Questions

Mathematics, 27.06.2019 10:20

History, 27.06.2019 10:20

Mathematics, 27.06.2019 10:20
English, 27.06.2019 10:20


