
Mathematics, 22.05.2020 22:01 lorraneb31
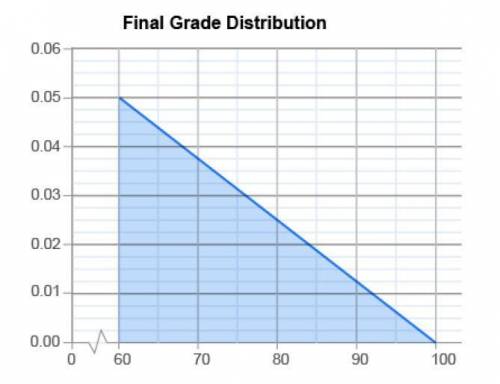
Mrs. Adams just gave the final exam for the Government course she teaches. Here's the density graph of the distribution of scores students earned on her final.
What is the probability of randomly choosing a student who scored 80% or less? A. 0.05 B. 0.25 C. 0.50 D. 0.75
What is the probability of randomly choosing a student who scored 70% or more? A. 0.4 B. 0.445 C. 0.5 D. 0.5625
What is the probability of randomly choosing a student who scored between 70% and 80%? A. 0.25 B. 0.3125 C. 0.45 D. 0.555

Answers: 1


Another question on Mathematics
Mathematics, 21.06.2019 18:00
Need on this geometry question. explain how you did it.
Answers: 2
Mathematics, 22.06.2019 03:00
The formula for finding volume of a cone 1/3pi x r^2h. the volume of a cone is 300 cm^3 and the height of the cone is 10 what is the approximate radius of the cone
Answers: 1
You know the right answer?
Mrs. Adams just gave the final exam for the Government course she teaches. Here's the density graph o...
Questions


Computers and Technology, 24.02.2020 16:29


Chemistry, 24.02.2020 16:30
History, 24.02.2020 16:30
Computers and Technology, 24.02.2020 16:30


