The graph below shows a company's profit f(x), in dollars, depending on the price of
erasers x...

Mathematics, 20.05.2020 15:57 Kadancepiggott7
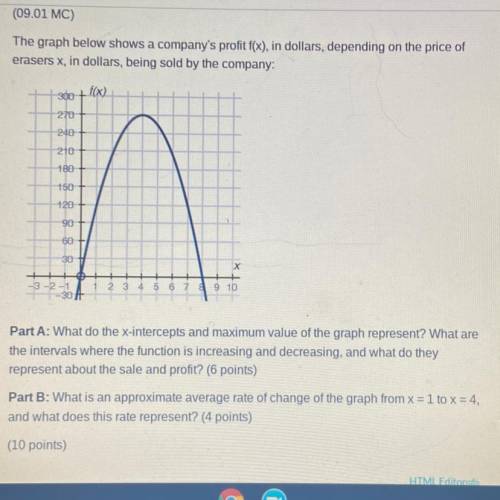
The graph below shows a company's profit f(x), in dollars, depending on the price of
erasers x, in dollars, being sold by the company:
30+ f(x)
270
NO
210
180
150
120
X
910
Part A: What do the x-intercepts and maximum value of the graph represent? What are
the intervals where the function is increasing and decreasing, and what do they
represent about the sale and profit? (6 points)
Part B: What is an approximate average rate of change of the graph from x = 1 to x = 4,
and what does this rate represent? (4 points)
Plz help

Answers: 1


Another question on Mathematics
Mathematics, 21.06.2019 17:30
Adriver from the university of florida women’s swimming and diving team is competing in the in ncaa zone b championships
Answers: 3
Mathematics, 21.06.2019 19:00
The lengths of all sides of a triangle are integers when measured in decimeters. one of the sides has length of 1 dm and another of 3 dm. find the perimeter of the triangle.'
Answers: 1
Mathematics, 21.06.2019 21:00
Isabel graphed the following system of equations. 2x – y = 6 y = -3x + 4 she came up with the solution (2,-2). what were the 3 steps she did to get that solution? (make sure they are in the correct order)
Answers: 2
You know the right answer?
Questions

Chemistry, 02.10.2020 16:01
Chemistry, 02.10.2020 16:01
Chemistry, 02.10.2020 16:01

History, 02.10.2020 16:01

Mathematics, 02.10.2020 16:01

English, 02.10.2020 16:01

Mathematics, 02.10.2020 16:01
Mathematics, 02.10.2020 16:01

Health, 02.10.2020 16:01


