
Mathematics, 17.05.2020 15:57 foziasif9525
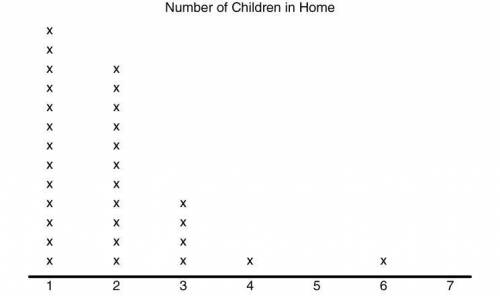
The following dot plot represents a random sample of elementary students and the number of children that live in their home.
Part 1: What is the range of the data set?
Part 2: What is the interquartile range of the data set?
Part 3: What is the mean absolute deviation of the data set? [Round both the mean and the mean absolute deviation to the nearest tenth.]

Answers: 3


Another question on Mathematics
Mathematics, 21.06.2019 14:10
which best describes the transformation from the graph of f(x) = x2 to the graph of f(x) = (x – 3)2 – 1? left 3 units, down 1 unitleft 3 units, up 1 unitright 3 units, down 1 unit right 3 units, up 1 unit
Answers: 1
Mathematics, 21.06.2019 16:40
The table shows the total distance that myra runs over different time periods. which describes myra’s distance as time increases? increasing decreasing zero constant
Answers: 1
Mathematics, 21.06.2019 17:30
Two customers went to a post office. first customer paid $12 for 14 and 5 envelopes the second paid 24.80 for 10 postcards and 15 envelopes. what is cost of each envelope?
Answers: 1
Mathematics, 21.06.2019 22:30
What fraction is equivalent to 0.46464646··· a. 46⁄999 b. 46⁄100 c. 46⁄99 d. 23⁄50
Answers: 1
You know the right answer?
The following dot plot represents a random sample of elementary students and the number of children...
Questions

History, 24.08.2021 06:00

Chemistry, 24.08.2021 06:00

Health, 24.08.2021 06:00
Mathematics, 24.08.2021 06:00


Mathematics, 24.08.2021 06:00
Chemistry, 24.08.2021 06:00
Mathematics, 24.08.2021 06:00
Mathematics, 24.08.2021 06:00
Mathematics, 24.08.2021 06:00
Mathematics, 24.08.2021 06:00


