70 points
A food truck did a daily survey of customers to find their food preferences. T...

Mathematics, 06.05.2020 18:02 marquion
70 points
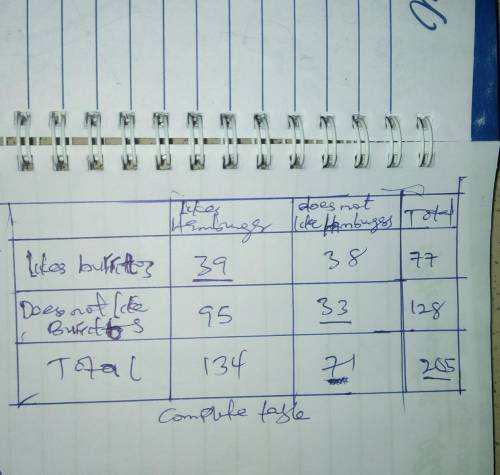
A food truck did a daily survey of customers to find their food preferences. The data is partially entered in the frequency table. Complete the table to analyze the data and answer the questions:
Likes hamburgers Does not like hamburgers Total
Likes burritos 38 77
Does not like burritos 95 128
Total 134 71
Part A: What percentage of the survey respondents did not like either hamburgers or burritos? (2 points)
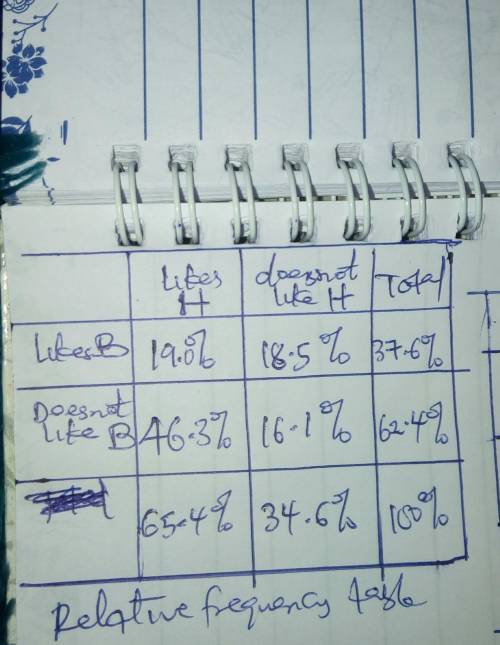
Part B: Create a relative frequency table and determine what percentage of students who like hamburgers also like burritos. (3 points)
Part C: Use the conditional relative frequencies to determine which data point has strongest association of its two factors. Use complete sentences to explain your answer. (5 points)

Answers: 2


Another question on Mathematics
Mathematics, 21.06.2019 17:10
Consider the following equation -167 + 37 = 49 - 21p select the equation that has the same solution as the given equation. o a. p - 5 + ip = 7 - p ob. +55 + 12p = 5p + 16 c. 2 + 1.25p = -3.75p + 10 d. -14 + 6p = -9 - 6p reset next
Answers: 3
Mathematics, 21.06.2019 18:00
What is the measure of angle tvu shown in the diagram below
Answers: 2
Mathematics, 21.06.2019 18:00
Henry is an avid reader, he devours 90 pages in half an hour how many pages has henry read per minute?
Answers: 1
Mathematics, 21.06.2019 18:30
How do you determine whether a relationship represented as as graph is linear or nonlinear
Answers: 1
You know the right answer?
Questions


Mathematics, 08.03.2021 04:00

Mathematics, 08.03.2021 04:00

Mathematics, 08.03.2021 04:00
Mathematics, 08.03.2021 04:00


