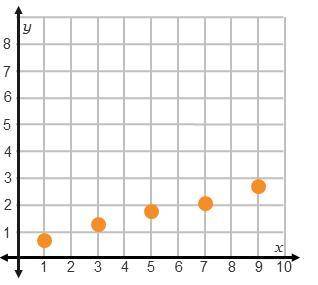
Consider the plot that was created from the residuals of a line of best fit for a set of data.
...

Mathematics, 05.05.2020 08:53 heids17043
Consider the plot that was created from the residuals of a line of best fit for a set of data.
Does the residual plot show that the line of best fit is appropriate for the data?
A)Yes, the points are rising.
B)Yes, the points are all above the x-axis.
C)No, it follows a pattern.
D)No, the points are falling.
30 points

Answers: 2


Another question on Mathematics
Mathematics, 21.06.2019 14:00
Find an equation of the line perpendicular to the graph.
Answers: 3
Mathematics, 21.06.2019 14:00
Which multiplicative property is being illustrated below? (type commutative, associative, or identity) 5 × 2 × 4 = 2 × 5 × 4
Answers: 1
Mathematics, 21.06.2019 17:30
Select the correct answer from the drop-down menu. subtracting 3xy^2 from 8xy^2 gives the same result as the expression. [tex]3xy ^{2} - 8xy ^{2} [/tex][tex] { - 7xy}^{2} - {2xy}^{2} [/tex][tex] {7xy}^{2} - {2xy}^{2} [/tex]
Answers: 3
Mathematics, 21.06.2019 20:00
Evaluate the discriminant of each equation. tell how many solutions each equation has and whether the solutions are real or imaginary. x^2 - 4x - 5 = 0
Answers: 2
You know the right answer?
Questions

Biology, 03.03.2021 01:00


Mathematics, 03.03.2021 01:00
Arts, 03.03.2021 01:00


Social Studies, 03.03.2021 01:00
Mathematics, 03.03.2021 01:00
Mathematics, 03.03.2021 01:00
Mathematics, 03.03.2021 01:00
Mathematics, 03.03.2021 01:00

History, 03.03.2021 01:00

Computers and Technology, 03.03.2021 01:00


