
Mathematics, 05.05.2020 02:52 jonnaevans4856
The data below shows the number of birds spotted by a bird watcher each hour over 10 hours:
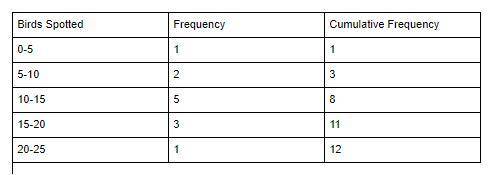
7, 11, 14, 3,17, 15, 21, 17, 10, 12
a. Create a cumulative frequency table to represent the data:
Birds Spotted:
Frequency Cumulative:
Frequency:
b. Create a histogram to represent the data:
c. Find the mean, median, mode, and range of the data:
d. Find the minimum, first quartile, third quartile, and maximum of the data:
e. Create a box-and-whisker plot to represent the data:
f. Find the 40th percentile for the data set:

Answers: 2


Another question on Mathematics
Mathematics, 21.06.2019 14:00
You and a friend race across a field to a fence and back. your friend has a 50-meter head start. the equations shown represent you and your friend's distances dd (in meters) from the fence tt seconds after the race begins. find the time at which you catch up to your friend. you: d=∣−5t+100∣d=∣−5t+100∣ your friend: d=∣−313t+50∣∣
Answers: 2
Mathematics, 21.06.2019 17:00
Parks is wearing several rubber bracelets one third of the bracelets are tie dye 1/6 are blue and 1/3 of the remainder are camouflage if park swears to camouflage bracelets how many bracelets does he have on
Answers: 2
Mathematics, 21.06.2019 17:30
In parallelogram abcd the ratio of ab to bcis 5: 3. if the perimeter of abcd is 32 find ab
Answers: 1
Mathematics, 22.06.2019 02:00
Aflagpole broke in a storm. 77 7 meters are still sticking straight out of the ground, where it snapped, but the remaining piece has hinged over and touches the ground at a point 2424 24 meters away horizontally
Answers: 1
You know the right answer?
The data below shows the number of birds spotted by a bird watcher each hour over 10 hours:
Questions


Chemistry, 15.12.2021 17:30


English, 15.12.2021 17:30
Mathematics, 15.12.2021 17:30
Mathematics, 15.12.2021 17:30


Geography, 15.12.2021 17:30
Biology, 15.12.2021 17:30


