Sammi wanted to create a dot plot based on this tally chart.
In which step, if any, did S...

Mathematics, 05.05.2020 00:03 oof78
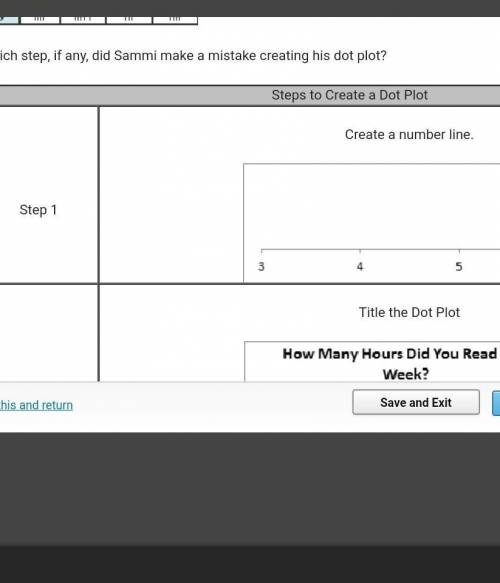
Sammi wanted to create a dot plot based on this tally chart.
In which step, if any, did Sammi make a mistake creating his dot plot?Sammi made a mistake in Step 1 because his number line did not include all numbers in the data set.
Sammi made a mistake in Step 2 because he chose a title without knowing if the table represents the number of hours read per week.
Sammi made a mistake in Step 3 because he did not correctly plot each dot above the appropriate place on the number line.
Sammi did not make a mistake.

Answers: 3


Another question on Mathematics
Mathematics, 21.06.2019 17:30
Any is very appreciated! (picture is provided below)not sure how to do this at all won't lie
Answers: 1
Mathematics, 21.06.2019 18:00
The sat and act tests use very different grading scales. the sat math scores follow a normal distribution with mean 518 and standard deviation of 118. the act math scores follow a normal distribution with mean 20.7 and standard deviation of 5. suppose regan scores a 754 on the math portion of the sat. how much would her sister veronica need to score on the math portion of the act to meet or beat regan's score?
Answers: 1
Mathematics, 21.06.2019 18:20
What value of x is in the solution set of 4x - 12 s 16 + 8x? -10 -9 -8 -7
Answers: 1
You know the right answer?
Questions
Mathematics, 23.04.2020 01:47


Mathematics, 23.04.2020 01:47
Mathematics, 23.04.2020 01:47


History, 23.04.2020 01:47
Mathematics, 23.04.2020 01:47
Chemistry, 23.04.2020 01:47

Arts, 23.04.2020 01:47
Mathematics, 23.04.2020 01:47
Biology, 23.04.2020 01:47


