Please help its due today :)))
The graph below plots the values of y for different value...

Mathematics, 05.05.2020 11:24 victoria6929
Please help its due today :)))
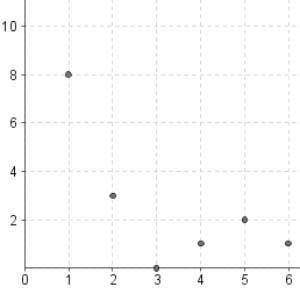
The graph below plots the values of y for different values of x:
What does a correlation coefficient of −0.2 say about this graph?
x and y have a strong, positive correlation
x and y have a weak, positive correlation
x and y have a strong, negative correlation
x and y have a weak, negative correlation

Answers: 2


Another question on Mathematics
Mathematics, 21.06.2019 19:10
Click an item in the list or group of pictures at the bottom of the problem and, holding the button down, drag it into the correct position in the answer box. release your mouse button when the item is place. if you change your mind, drag the item to the trashcan. click the trashcan to clear all your answers. solve this quadratic equation using the quadratic formula. 2x2 - 2x=1 need asap
Answers: 2
Mathematics, 21.06.2019 22:00
Billie holiday sells children's clothing for sara vaughn's toddler shop. baby blankets sell for $29.99 after a markup rate based on cost of 109%. find the cost and the markup.
Answers: 2
Mathematics, 22.06.2019 00:00
Find the distance between the point (-3,-4), and (see the picture below)
Answers: 1
Mathematics, 22.06.2019 01:30
If two lines form congruent alternate interior angles with a transversal, then the lines
Answers: 2
You know the right answer?
Questions


Chemistry, 10.10.2021 15:10

Social Studies, 10.10.2021 15:10

Physics, 10.10.2021 15:10
Physics, 10.10.2021 15:10

Health, 10.10.2021 15:10
Mathematics, 10.10.2021 15:10

Mathematics, 10.10.2021 15:10
Mathematics, 10.10.2021 15:10
Mathematics, 10.10.2021 15:10

Mathematics, 10.10.2021 15:10
Biology, 10.10.2021 15:10


