Score (points)

Mathematics, 05.05.2020 17:06 katiebonar13
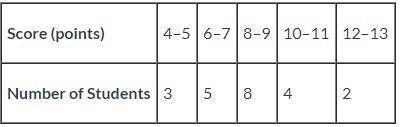
A group of 22 students participated in a race. Their scores are below:
Score (points)
4–5
6–7
8–9
10–11
12–13
Number of Students
3
5
8
4
2
Would a dot plot or a histogram best represent the data presented here? Why?
Group of answer choices
Dot plot, because a large number of scores are reported as ranges
Dot plot, because a small number of scores are reported individually
Histogram, because a large number of scores are reported as ranges
Histogram, because a small number of scores are reported individually

Answers: 2


Another question on Mathematics
Mathematics, 21.06.2019 14:30
F(x)= 1/x-4, g(x)=4x+1/x a. use composition to prove whether or not the functions are inverses of each other. b. express the domain of the compositions using interval notation.
Answers: 2
Mathematics, 21.06.2019 23:30
Adele is five years older than timothy. in three years, timothy will be 2/3 of adele’s age. what is adele‘s current age?
Answers: 1
Mathematics, 22.06.2019 01:40
Amass weighing 16 pounds stretches a spring 8/3 feet. the mass is initially released from rest from a point 2 feet below the equilibrium position, and the subsequent motion takes place in a medium that offers a damping force that is numerically equal to 1/2 the instantaneous velocity. find the equation of motion if the mass is driven by an external force equal to f(t)=cos(2t).
Answers: 2
You know the right answer?
A group of 22 students participated in a race. Their scores are below:
Score (points)
Score (points)
Questions


Business, 07.10.2021 01:00
Mathematics, 07.10.2021 01:00
Mathematics, 07.10.2021 01:00

History, 07.10.2021 01:00


Chemistry, 07.10.2021 01:00

Computers and Technology, 07.10.2021 01:00
Mathematics, 07.10.2021 01:00
English, 07.10.2021 01:00

Computers and Technology, 07.10.2021 01:00

Medicine, 07.10.2021 01:00


