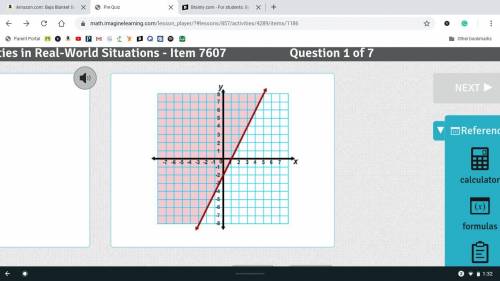
Which inequality describes the graph?
A. y ≥ -2 + 2x
B. y – 2 ≥ -2x
C. y ≤ 2...

Mathematics, 06.05.2020 05:17 Tabbicat021
Which inequality describes the graph?
A. y ≥ -2 + 2x
B. y – 2 ≥ -2x
C. y ≤ 2x – 2
D. y > 2x – 2

Answers: 1


Another question on Mathematics
Mathematics, 21.06.2019 23:40
The function f(x) is shown in this graph the function g(x)=6x
Answers: 2
Mathematics, 22.06.2019 01:30
What is the t intercept of the line given by the equation below y= -10x + 14
Answers: 3
Mathematics, 22.06.2019 02:30
Witch sequence shows a pattern where each term is 1.5 times the previous term
Answers: 3
You know the right answer?
Questions
Mathematics, 16.07.2021 22:10


History, 16.07.2021 22:10


Mathematics, 16.07.2021 22:10

Chemistry, 16.07.2021 22:10

Mathematics, 16.07.2021 22:10
History, 16.07.2021 22:10
Chemistry, 16.07.2021 22:10
English, 16.07.2021 22:10
Mathematics, 16.07.2021 22:10


