
Mathematics, 25.04.2020 04:25 DangerDash
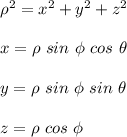
Use spherical coordinates to find the volume of the region bounded by the sphere rhoequals28 cosine phi and the hemisphere rhoequals14, zgreater than or equals0. An x y z coordinate system has an x-axis with a tick mark at 14, a y-axis with a tick mark at 14, and a vertical positive z-axis with an unlabeled tick mark. A hemisphere has a circular base in the x y plane with center at the origin and radius 14, and its point farthest from the origin is on the positive z-axis at the unlabeled tick mark. A sphere has its center on the positive z-axis at the unlabeled tick mark and its lowest point at the origin. In the plane parallel to the x y axis at the unlabeled positive z-axis tick mark, the sphere's has its point with the greatest x-coordinate, at 14, and its point with the greatest y-coordinate, at 14. x y z 14 14 The volume of the region bounded by the sphere and the hemisphere is nothing. (Type an exact answer, using pi as needed.)

Answers: 2

 and the hemisphere


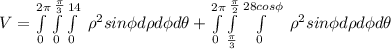
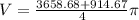
![V = \int\limits^{2\pi}_0 \int\limits^{\frac{\pi}{3}}_0 [\frac{\rho^3}{3}]^{14}__0}} \ sin \phi d \phi d \theta + \int\limits^{2\pi}_0 \int\limits^{\frac{\pi}{2}}_{\frac{\pi}{3}} [\frac{\rho^3}{3}]^{28 cos \phi}__0}} \ sin \phi d \phi d \theta](/tpl/images/0626/7068/457f0.png)
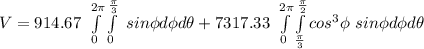
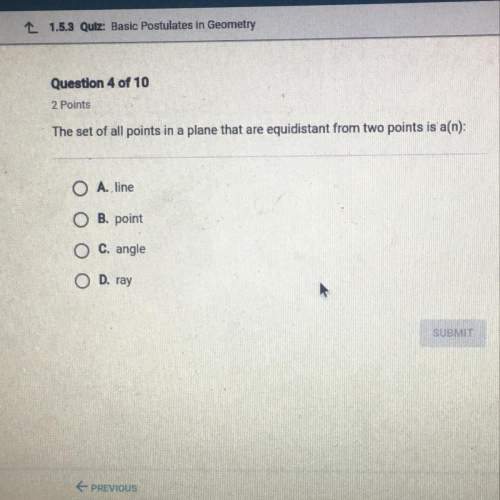
![V = 914.67[-cos \phi]^{\frac{\pi}{3}}}__0}}}[\theta]^{2\pi}__0}} + 7317.33[- \frac{cos^4 \phi}{4}]^{\frac{\pi}{2}}__{\frac{\pi}{3}}} [\theta]^{2 \pi}_o](/tpl/images/0626/7068/5d187.png)
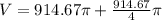
 + 7317.33[ \frac{1}{64}](2 \pi)](/tpl/images/0626/7068/7e32f.png)


Another question on Mathematics
Mathematics, 21.06.2019 18:30
At the olympic games, many events have several rounds of competition. one of these events is the men's 100-meter backstroke. the upper dot plot shows the times (in seconds) of the top 8 finishers in the final round of the 2012 olympics. the lower dot plot shows the times of the same 8 swimmers, but in the semifinal round. which pieces of information can be gathered from these dot plots? (remember that lower swim times are faster.) choose all answers that apply: a: the swimmers had faster times on average in the final round. b: the times in the final round vary noticeably more than the times in the semifinal round. c: none of the above.
Answers: 2
Mathematics, 22.06.2019 03:00
Select quivalent or not equivalent to indicate whether the expression above is equivalent or not equivalent to the values or expressions in the last column.
Answers: 3
Mathematics, 22.06.2019 03:20
Arepresentative from plan 1 wants to use the graph below to sell health plans for his company. how might the graph be redrawn to emphasize the difference between the cost per doctor visit for each of the three plans? the scale on the y-axis could be changed to 0–100. the scale on the y-axis could be changed to 25–40. the interval of the y-axis could be changed to count by 5s. the interval of the y-axis could be changed to count by 20s.
Answers: 2
Mathematics, 22.06.2019 04:30
Imade a beaded necklace that was 2/6 blue, 3/5 green and the rest were white. did the necklace have more blue or green how many white beads did it have.
Answers: 1
You know the right answer?
Use spherical coordinates to find the volume of the region bounded by the sphere rhoequals28 cosine...
Questions

History, 17.02.2021 02:30

Physics, 17.02.2021 02:30

Business, 17.02.2021 02:30

Social Studies, 17.02.2021 02:30

English, 17.02.2021 02:30
Mathematics, 17.02.2021 02:30
Mathematics, 17.02.2021 02:30
History, 17.02.2021 02:30

History, 17.02.2021 02:30

Biology, 17.02.2021 02:30
English, 17.02.2021 02:30

Advanced Placement (AP), 17.02.2021 02:30
Mathematics, 17.02.2021 02:30


