The graph shows the height of a hiker above sea level.
the hiker walks at a constant sp...

Mathematics, 02.10.2019 12:10 genyjoannerubiera
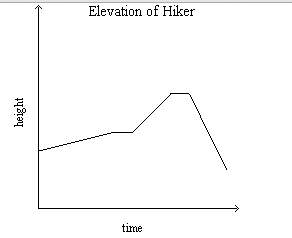
The graph shows the height of a hiker above sea level.
the hiker walks at a constant speed for the entire trip. what are the variables? describe how the variables are related at various points on the graph.
a. the variables are height and time. for the first part of the graph, the height is increasing slowly, which means the hiker is climbing a steep incline. flat parts of the graph show where the elevation does not change, which means the hiker stopped to rest. the steep part at the end of the graph shows that the hiker is descending a gentle slope.
b. the variables are height and time. for the first part of the graph, the height is increasing slowly, which means the hiker is walking up a gentle slope. flat parts of the graph show where the elevation does not change, which means the trail is flat here. the steep part at the end of the graph shows that the hiker is descending a steep incline.
c. the variables are height and time. for the first part of the graph, the height is increasing slowly, which means the hiker is climbing a steep incline. flat parts of the graph show where the elevation does not change, which means the trail is flat here. the steep part at the end of the graph shows that the hiker is descending a steep incline.
d. all of the above.

Answers: 2


Another question on Mathematics
Mathematics, 21.06.2019 17:30
How many kilometers are equal to 5 miles? use 1 mile ≈ 1.61 kilometers. !
Answers: 2
Mathematics, 21.06.2019 22:00
Determine if the equation defines y as a function of x: 2xy = 1. yes o no
Answers: 2
Mathematics, 21.06.2019 23:20
Which expression is a factor of 12x2 + 29x – 8? x – 8 2x – 1 3x + 8 4x + 1
Answers: 1
You know the right answer?
Questions
Mathematics, 11.12.2021 19:30


Chemistry, 11.12.2021 19:30

Spanish, 11.12.2021 19:30


Computers and Technology, 11.12.2021 19:30
English, 11.12.2021 19:30
Mathematics, 11.12.2021 19:30


French, 11.12.2021 19:40

History, 11.12.2021 19:40

Advanced Placement (AP), 11.12.2021 19:40


