Both parts use the same picture.
Part A
Which measure of center would you us...

Mathematics, 22.04.2020 23:52 brittanyrenner6657
Both parts use the same picture.
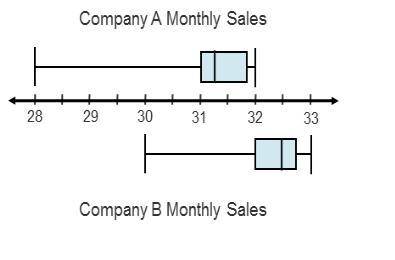
Part A
Which measure of center would you use to compare the populations represented by the box plots?
A. median
B. mean
C. mean absolution deviation (MAD)
D. interquartile range (IQR)
Part B
Which measure of variability would you use to compare the populations represented by the box plots?
A. median
B. mean
C. mean absolution deviation (MAD)
D. interquartile range (IQR)

Answers: 2


Another question on Mathematics
Mathematics, 21.06.2019 14:00
Which unit of measure would be the most appropriate to measure the capacity of a bottle of nail polish? a.fluid ounces b.cups c.pints d.quarts e.gallons
Answers: 1
Mathematics, 21.06.2019 16:50
Which undefined geometric term is described as a location on a coordinate plane that is designed by an ordered pair (x,y) ?
Answers: 1
Mathematics, 22.06.2019 00:30
I've been working on this for a few days and i just don't understand, it's due in a few hours. you. the direction of a vector is defined as the angle of the vector in relation to a horizontal line. as a standard, this angle is measured counterclockwise from the positive x-axis. the direction or angle of v in the diagram is α. part a: how can you use trigonometric ratios to calculate the direction α of a general vector v = < x, y> similar to the diagram? part b suppose that vector v lies in quadrant ii, quadrant iii, or quadrant iv. how can you use trigonometric ratios to calculate the direction (i.e., angle) of the vector in each of these quadrants with respect to the positive x-axis? the angle between the vector and the positive x-axis will be greater than 90 degrees in each case. part c now try a numerical problem. what is the direction of the vector w = < -1, 6 > ?
Answers: 1
Mathematics, 22.06.2019 01:30
In 2000, for a certain region, 27.1% of incoming college freshman characterized their political views as liberal, 23.1% as moderate, and 49.8% as conservative. for this year, a random sample of 400 incoming college freshman yielded the frequency distribution for political views shown below. a. determine the mode of the data. b. decide whether it would be appropriate to use either the mean or the median as a measure of center. explain your answer. political view frequency liberal 118 moderate 98 conservative 184 a. choose the correct answer below. select all that apply. a. the mode is moderate. b. the mode is liberal. c. the mode is conservative. d. there is no mode.
Answers: 1
You know the right answer?
Questions


Biology, 20.10.2019 16:30

Chemistry, 20.10.2019 16:30


Health, 20.10.2019 16:30

Chemistry, 20.10.2019 16:30
Mathematics, 20.10.2019 16:30
Mathematics, 20.10.2019 16:30
Mathematics, 20.10.2019 16:30
Mathematics, 20.10.2019 16:30

Health, 20.10.2019 16:30
Mathematics, 20.10.2019 16:30

Social Studies, 20.10.2019 16:30


