
Mathematics, 22.04.2020 01:55 KallMeh
The following data contains coaches' salaries and team revenues (in millions of dollars) for ten college basketball teams. Use these data to complete parts (a) through(c).
Salary 0.4 0.8 1.4 1.3 1.2 1.9 0.5 0.9 1.5 0.6
Revenue 4.9 7.5 17.2 18.2 11.5 13.6 8.0 6.0 18.0 8.2
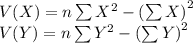
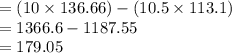
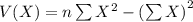
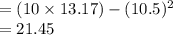
a. Compute the covariance.
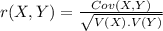
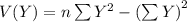
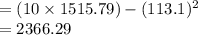
b. Compute the coefficient of correlation.
c. What conclusions can you reach about the relationship between a coach's salary and revenue?
A. There is a strong positive relationship between a coach's salary and revenue. As a coach's salary increases, revenue always increases.
B. There is a moderate positive relationship between a coach's salary and revenue. As a coach's salary increases, revenue tends to increase.
C. There is a slight relationship between a coach's salary and revenue. Increases in a coach's salary cause increases in revenue.
D. There is no relationship between a coach's salary and revenue.

Answers: 1


Another question on Mathematics
Mathematics, 21.06.2019 17:30
How many kilometers are equal to 5 miles? use 1 mile ≈ 1.61 kilometers. !
Answers: 2
Mathematics, 21.06.2019 20:30
Hi if you want to play a sports related kahoot go to kahoot.it and type in this code: 659344
Answers: 1
Mathematics, 22.06.2019 03:40
Which is the graph of linear inequality 2y > x – 2? image for option 1 image for option 2 image for option 3 image for option 4
Answers: 3
Mathematics, 22.06.2019 04:30
Draw a geometric diagram of this scenario using two parallel lines and one transversal. (remember that a transversal is a line which cuts across parallel lines.) label the angles, parallel lines, and transversal as indicated in the diagram above.
Answers: 2
You know the right answer?
The following data contains coaches' salaries and team revenues (in millions of dollars) for ten col...
Questions
Mathematics, 30.09.2019 23:50
Mathematics, 30.09.2019 23:50

Mathematics, 30.09.2019 23:50
Mathematics, 30.09.2019 23:50
Mathematics, 30.09.2019 23:50


Health, 30.09.2019 23:50

History, 30.09.2019 23:50


Mathematics, 30.09.2019 23:50

Biology, 30.09.2019 23:50
History, 30.09.2019 23:50
History, 30.09.2019 23:50


