Mathematics, 22.04.2020 00:43 johnsnow69
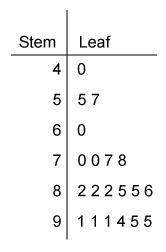
Why is it helpful, when looking for irregular data, to identify whether the graph of a data set is usually symmetrical?
It demonstrates the accuracy of the graph; if asymmetrical data is present, it is erroneous.
It can indicate faulty data or an atypical data set if such data is normally symmetrical but is now asymmetrical.
It shows whether there has been an error in plotting the data by the researcher.
It illustrates any flaws in the design of the research study, particularly in choosing test subjects.

Answers: 2


Another question on Mathematics

Mathematics, 21.06.2019 17:00
You have $600,000 saved for retirement. your account earns 5.5% interest. how much, to the nearest dollar, will you be able to pull out each month, if you want to be able to take withdrawals for 20 years?
Answers: 1

Mathematics, 21.06.2019 20:30
Create a question with this scenario you could ask that could be answered only by graphing or using logarithm. david estimated he had about 20 fish in his pond. a year later, there were about 1.5 times as many fish. the year after that, the number of fish increased by a factor of 1.5 again. the number of fish is modeled by f(x)=20(1.5)^x.
Answers: 1

Mathematics, 22.06.2019 00:10
Use your knowledge of the binary number system to write each binary number as a decimal number. a) 1001 base 2= base 10 b) 1101 base 2 = base 10
Answers: 1

Mathematics, 22.06.2019 03:00
25 ! what is the value of x? enter your answer in the box. x =
Answers: 2
You know the right answer?
Why is it helpful, when looking for irregular data, to identify whether the graph of a data set is u...
Questions


Mathematics, 01.09.2021 20:40

Biology, 01.09.2021 20:40


Mathematics, 01.09.2021 20:40

Mathematics, 01.09.2021 20:40


Mathematics, 01.09.2021 20:40

Mathematics, 01.09.2021 20:40


