
Mathematics, 19.04.2020 10:19 ryleepretty
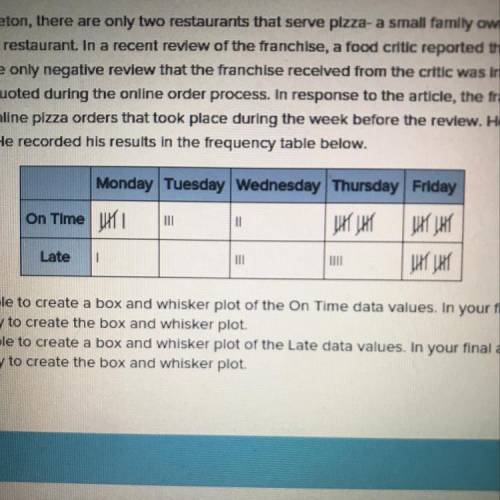
1. Use the frequency table to create a box and whisker plot of the On Time data values. In your final answer include all
calculations necessary to create the box and whisker plot.
2. Use the frequency table to create a box and whisker plot of the Late data values. In your final answer, include all
calculations necessary to create the box and whisker plot.

Answers: 3


Another question on Mathematics
Mathematics, 20.06.2019 18:04
How many degrees does the hour hand move from 3: 00 to 5: 30?
Answers: 1
Mathematics, 21.06.2019 14:40
Write the sentence as an equation. z plus 372 is equal to 160
Answers: 2
Mathematics, 21.06.2019 18:30
The height of a flare fired from the deck of a ship in distress can be modeled by h(t)= -2(8t^2-52t-28), where h is the height of the flare above water and t is the time in seconds. a. find the time it takes the flare to hit the water.
Answers: 1
Mathematics, 21.06.2019 19:00
Rob spent 25%, percent more time on his research project than he had planned. he spent an extra h hours on the project. which of the following expressions could represent the number of hours rob actually spent on the project? two answers
Answers: 3
You know the right answer?
1. Use the frequency table to create a box and whisker plot of the On Time data values. In your fina...
Questions
Mathematics, 09.06.2021 19:00


Biology, 09.06.2021 19:00

Mathematics, 09.06.2021 19:00
Mathematics, 09.06.2021 19:00
Mathematics, 09.06.2021 19:00
Mathematics, 09.06.2021 19:00
Mathematics, 09.06.2021 19:00
Mathematics, 09.06.2021 19:00

Mathematics, 09.06.2021 19:00
Mathematics, 09.06.2021 19:10
Mathematics, 09.06.2021 19:10


