Please help! Will give good rating.
Dot Plot Data:
20, 21, 21, 25, 20, 23, 27, 23, 2...

Mathematics, 17.04.2020 01:59 puppylove899
Please help! Will give good rating.
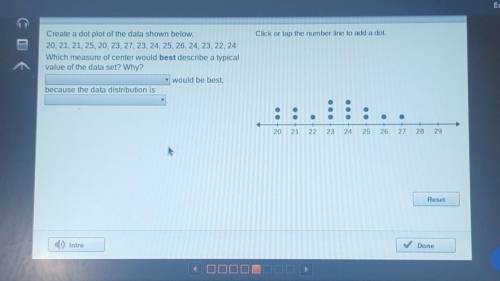
Dot Plot Data:
20, 21, 21, 25, 20, 23, 27, 23, 24, 25, 26, 24, 23, 22, 24
Which measure of center would best describe a typical
value of the data set? Why?
_would be best,
because the data distribution is _.
fill in the blank options:
1) The mean, Neither the mean nor median
2) Nearly symmetrical, neither symmetrical nor skewed

Answers: 2


Another question on Mathematics
Mathematics, 21.06.2019 20:00
Aclothing store has the sign shown in the shop window. pani sees the sign and wants to buy 3 shirts and 2 pairs of jeans. the cost of each shirt before the discount is $12, and the cost of each pair of jeans is $19 before the discount. write and simplify an expression to find the amount pani pays if a $3 discount is applied to her total
Answers: 2
Mathematics, 22.06.2019 01:50
Point q is equidistant from the sides of ∠tsr. find m∠rst.
Answers: 2
Mathematics, 22.06.2019 03:00
He letter p on the number line below represents the number . (use the hyphen for negative numbers and write answer as a decimal, such as –7.2) number line from negative 7 to positive 7 in increments of 0.5 is shown. only the whole numbers are labeled. a point labeled p is placed at the eleventh tick mark to the left of 0.
Answers: 3
Mathematics, 22.06.2019 04:00
At school 460 of the students walk to school the number of students who take public transit is 20% of the number of students who walk. how many students take public transit
Answers: 2
You know the right answer?
Questions

Mathematics, 01.04.2020 16:26

English, 01.04.2020 16:26


Mathematics, 01.04.2020 16:26

Mathematics, 01.04.2020 16:26
Chemistry, 01.04.2020 16:26
Biology, 01.04.2020 16:27
Mathematics, 01.04.2020 16:27
Biology, 01.04.2020 16:27

English, 01.04.2020 16:27


