
Mathematics, 15.04.2020 01:19 lexipiper8296
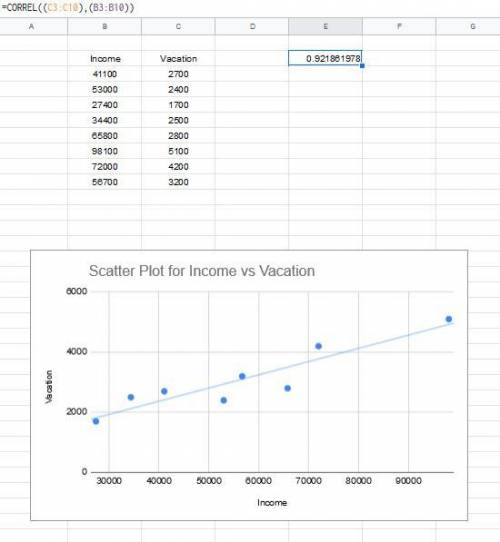
The following table shows the annual income, in dollars, and amount spent on vacation, in dollars, for a sample of 8 families.
Income 41,100 53,000 27,400 34,400 65,800 98,100 72,000 56,700
Vacation 2,700 2,400 1,700 2,500 2,800 5,100 4,200 3,200
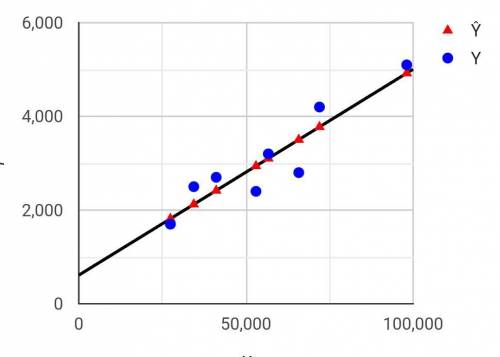
(a) Create a scatterplot of the data in the table.
(b) Describe the association shown in the scatterplot created in part (a).
(c) Calculate the coefficient of determination for the data, and interpret the value in context.

Answers: 3
![r=\frac{n(\sum xy)-(\sum x)(\sum y)}{\sqrt{[n\sum x^2-(\sum x)^2][n\sum y^2-(\sum y)^2}}\\\\\\\sum xy=153914\\\sum x=4485\\\sum y=246\\\sum x^2=2878447\\(\sum x)^2=4485^2=20115225\\(\sum y)^2=246^2=60516\\\sum y^2=8392\\n=8\\\\\#substitute \ and \ solve \ for \ r\\\\=\frac{8\times153914-4485\times 246}{\sqrt{[8\times 2878447-4485^2][8\times 8392-246^2]}}\\\\=0.92186\\\\\approx 0.9219](/tpl/images/0600/5176/3852f.png)


Another question on Mathematics
Mathematics, 21.06.2019 20:30
Stacey filled her 1/2 cup of measuring cup seven times to have enough flour for a cake recipe how much flour does the cake recipe calls for
Answers: 2
Mathematics, 21.06.2019 21:00
The zoo collects $9.60 for every 24 tickets sold. how much will be collected for 400 tickets?
Answers: 2
Mathematics, 21.06.2019 21:30
Acd that is originally priced at $15.85 red-tagged for the sale. what is the sale price of the cd
Answers: 1
Mathematics, 21.06.2019 23:30
Find │–14│ a. 14 b. –14 c. start fraction 1 over 14 end fraction
Answers: 2
You know the right answer?
The following table shows the annual income, in dollars, and amount spent on vacation, in dollars, f...
Questions

Mathematics, 12.04.2021 22:10


Biology, 12.04.2021 22:10

Physics, 12.04.2021 22:10
Mathematics, 12.04.2021 22:10

Mathematics, 12.04.2021 22:10

History, 12.04.2021 22:10
Mathematics, 12.04.2021 22:10


