
Mathematics, 14.04.2020 18:55 jaida03
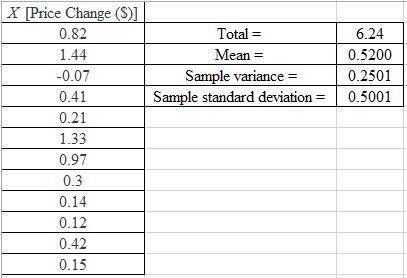
The table showing the stock price changes for a sample of 12 companies on a day is contained in the Excel file below.
Price Change ($)
0.82
1.44
-0.07
0.41
0.21
1.33
0.97
0.30
0.14
0.12
0.42
0.15
Construct a spreadsheet to answer the following questions.
a. Compute the sample variance for the daily price change (to 4 decimals).
b. Compute the sample standard deviation for the price change (to 4 decimals).
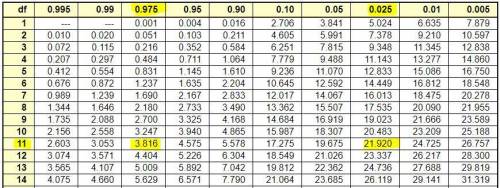
c. Provide 95% confidence interval estimates of the population variance (to 4 decimals).

Answers: 1

 =AVERAGE(A2:A13)
 =VAR.S(A2:A13)
 =STDEV.S(A2:A13)
![CI=[\frac{(n-1)s^{2}}{\chi^{2}_{\alpha/2} } \leq \sigma^{2}\leq \frac{(n-1)s^{2}}{\chi^{2}_{1-\alpha/2} } ]](/tpl/images/0598/7478/a42f6.png)


![=[\frac{(12-1)\times 0.2501}{21.920 } \leq \sigma^{2}\leq \frac{(12-1)\times 0.2501}{3.816} ]](/tpl/images/0598/7478/f887c.png)
![=[0.125506\leq \sigma^{2}\leq 0.720938]\\\approx [0.1255, 0.7210]](/tpl/images/0598/7478/e0a86.png)


Another question on Mathematics
Mathematics, 21.06.2019 18:30
The final cost of a sale is determined by multiplying the price on the tag by 75%. which best describes the function that represents the situation?
Answers: 1
Mathematics, 21.06.2019 19:00
If (x-2) 2= 49, then x could be a. -9 b. -7 c.- 2 d. 5 e.9
Answers: 2
Mathematics, 21.06.2019 20:30
Apinhole camera is made out of a light-tight box with a piece of film attached to one side and pinhole on the opposite side. the optimum diameter d(in millimeters) of the pinhole can be modeled by d=1.9[ (5.5 x 10^-4) l) ] ^1/2, where l is the length of the camera box (in millimeters). what is the optimum diameter for a pinhole camera if the camera box has a length of 10 centimeters
Answers: 1
You know the right answer?
The table showing the stock price changes for a sample of 12 companies on a day is contained in the...
Questions

History, 13.01.2020 19:31

Computers and Technology, 13.01.2020 19:31
History, 13.01.2020 19:31
History, 13.01.2020 19:31

Biology, 13.01.2020 19:31

Chemistry, 13.01.2020 19:31
Mathematics, 13.01.2020 19:31
Mathematics, 13.01.2020 19:31

English, 13.01.2020 19:31

Business, 13.01.2020 19:31
Biology, 13.01.2020 19:31


