
Mathematics, 10.04.2020 14:27 briannawoods13
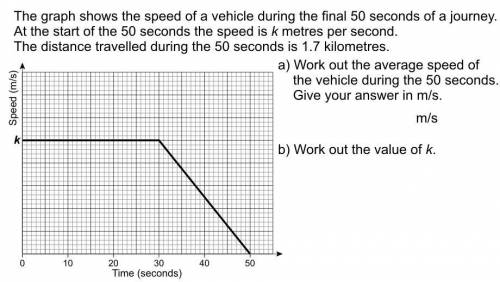
The graph shows the speed of a vehicle during the final 50 seconds of a journey. At the start of the 50 seconds its speed is k metres per second. The distance travelled during the 50 seconds is 1.7 kilometres
can you work out the average speed of the vehicle during the 50 seconds of the journey?

Answers: 1


Another question on Mathematics
Mathematics, 21.06.2019 15:00
Asap the total attendance for all of a baseball league in 2012 was about 7.5×10⁷ fans, while the attendance for the tornadoes in 2012 was about 1.5×10⁶ fans. about how many times more was the attendance for the entire baseball league than the attendance for just the tornadoes? 50 times more 10 times more 2 times more 5 times more
Answers: 2
Mathematics, 21.06.2019 18:30
Florence price's brownies and more sells all types of cookies and pastries. on tuesdays, they markdown all brownies 75% to a sale of $1.50 a dozen. find the selling price and the markdown of a dozen brownies.
Answers: 1
Mathematics, 21.06.2019 20:30
Suppose you just purchased a digital music player and have put 8 tracks on it. after listening to them you decide that you like 4 of the songs. with the random feature on your player, each of the 8 songs is played once in random order. find the probability that among the first two songs played (a) you like both of them. would this be unusual? (b) you like neither of them. (c) you like exactly one of them. (d) redo () if a song can be replayed before all 8 songs are played.
Answers: 2
You know the right answer?
The graph shows the speed of a vehicle during the final 50 seconds of a journey. At the start of the...
Questions

Mathematics, 27.02.2020 19:12
Mathematics, 27.02.2020 19:12

History, 27.02.2020 19:13

Chemistry, 27.02.2020 19:13

Mathematics, 27.02.2020 19:13

Computers and Technology, 27.02.2020 19:14
Mathematics, 27.02.2020 19:14


