
Mathematics, 08.04.2020 02:34 ashled7789
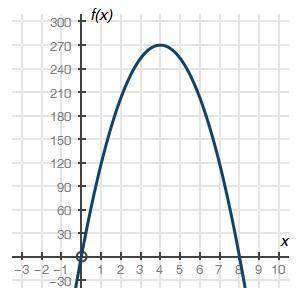
The graph below shows a company's profit f(x), in dollars, depending on the price of erasers x, in dollars, being sold by the company:
Part A: What do the x-intercepts and maximum value of the graph represent? What are the intervals where the function is increasing and decreasing, and what do they represent about the sale and profit? (3 points)
Part B: What is an approximate average rate of change of the graph from x = 1 to x = 4, and what does this rate represent?

Answers: 2


Another question on Mathematics
Mathematics, 21.06.2019 13:20
Which equation can be used to solve for the unknown number? seven less than a number is thirteen. n-7=13 7-n=13 n+7=13 n+13=7
Answers: 1
Mathematics, 21.06.2019 15:20
Which of the following describes how to translate the graph y = xi to obtain the graph of y = x - 11 - 12 1 unit left and 1 unit down 1 unit left and 1 unit up 1 unit right and 1 unit down 1 unit right and 1 unit up
Answers: 2
Mathematics, 21.06.2019 16:50
Factor -8x3-2x2-12x-3 by grouping what is the resulting expression?
Answers: 2
You know the right answer?
The graph below shows a company's profit f(x), in dollars, depending on the price of erasers x, in d...
Questions
Mathematics, 23.05.2021 19:20

French, 23.05.2021 19:20
Mathematics, 23.05.2021 19:20
Mathematics, 23.05.2021 19:20
SAT, 23.05.2021 19:20


History, 23.05.2021 19:20

Chemistry, 23.05.2021 19:20
Mathematics, 23.05.2021 19:20
Mathematics, 23.05.2021 19:20
Mathematics, 23.05.2021 19:20

Social Studies, 23.05.2021 19:20

Mathematics, 23.05.2021 19:20
Mathematics, 23.05.2021 19:20


