
Mathematics, 06.04.2020 23:10 cristinavalencia03
Every few years, the National Assessment of Educational Progress asks a national sample of eighth-graders to perform the same math tasks. The goal is to get an honest picture of progress in math. Suppose these are the last few national mean scores, on a scale of 0 to 500.
Year 1990 1992 1996 2000 2003 2005 2008
Score 263 268 271 272 276 277 279
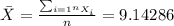
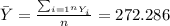
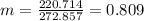
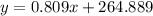
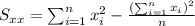
(a) Find the regression line of mean score on time step-by-step. First calculate the mean and standard deviation of each variable and their correlation (use a calculator with these functions). Then find the equation of the least-squares line from these
(b) What percent of the year-to-year variation in scores is explained by the linear trend?

Answers: 1

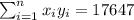
![r=\frac{n(\sum xy)-(\sum x)(\sum y)}{\sqrt{[n\sum x^2 -(\sum x)^2][n\sum y^2 -(\sum y)^2]}}](/tpl/images/0585/0730/ec454.png)
![r=\frac{7(17647)-(64)(1906)}{\sqrt{[7(858) -(64)^2][7(519164) -(1906)^2]}}=0.97599](/tpl/images/0585/0730/738ef.png)


 and we got:


Another question on Mathematics
Mathematics, 21.06.2019 16:40
According to the number line, what is the distance between points a and b? v ++ + + + + -16 -14 -12 -10 -8 + 6 + 4 + -2 + 0 + 2 + 4 + 6 + 8 + 10 + 12 + 14 + 16 o6 units o 7 units 12 units o 14 units
Answers: 1
Mathematics, 21.06.2019 23:30
Darren earned $663.26 in net pay for working 38 hours. he paid $118.51 in federal and state income taxes, and $64.75 in fica taxes. what was darren's hourly wage? question options: $17.45 $19.16 $20.57 $22.28
Answers: 3
Mathematics, 22.06.2019 08:00
Which expression models the phrase “wally mowed two more lawns than he mowed last week”? n+2 n-2 2-n 2n
Answers: 1
You know the right answer?
Every few years, the National Assessment of Educational Progress asks a national sample of eighth-gr...
Questions


Mathematics, 22.06.2019 17:00

Business, 22.06.2019 17:00
History, 22.06.2019 17:00
Mathematics, 22.06.2019 17:00

History, 22.06.2019 17:00


