subject
Mathematics, 31.03.2020 23:01 aliami0306oyaj0n

PLEASE HELP

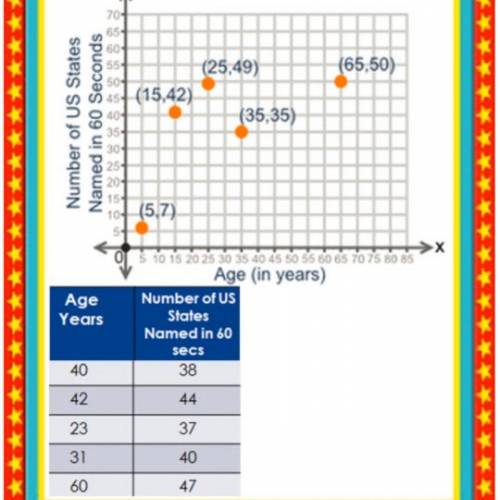
Plot the S ordered pairs from the table
on the coordinate plane.

Label any outliers or clusters. Why did
you pick them?

Draw the line of best fit.
How did you know where to draw the
line of best fit?

What is the association of your
scatterplot? Positive/Negative/No

Write a verbal statement to describe
your scatter plot.


PLEASE HELP  Plot the S ordered pairs from the table on the coordinate plane. Label any outliers or

ansver
Answers: 3

Another question on Mathematics

question
Mathematics, 21.06.2019 17:00
Which graph corresponds to the function f(x) = x2 + 4x – 1?
Answers: 1
question
Mathematics, 21.06.2019 19:40
It appears that people who are mildly obese are less active than leaner people. one study looked at the average number of minutes per day that people spend standing or walking. among mildly obese people, the mean number of minutes of daily activity (standing or walking) is approximately normally distributed with mean 376 minutes and standard deviation 64 minutes. the mean number of minutes of daily activity for lean people is approximately normally distributed with mean 528 minutes and standard deviation 107 minutes. a researcher records the minutes of activity for an srs of 7 mildly obese people and an srs of 7 lean people. use z-scores rounded to two decimal places to answer the following: what is the probability (image for it appears that people who are mildly obese are less active than leaner people. one study looked at the averag0.0001) that the mean number of minutes of daily activity of the 6 mildly obese people exceeds 420 minutes? what is the probability (image for it appears that people who are mildly obese are less active than leaner people. one study looked at the averag0.0001) that the mean number of minutes of daily activity of the 6 lean people exceeds 420 minutes?
Answers: 1
question
Mathematics, 21.06.2019 20:30
Max recorded the heights of 500 male humans. he found that the heights were normally distributed around a mean of 177 centimeters. which statements about max’s data must be true? a) the median of max’s data is 250 b) more than half of the data points max recorded were 177 centimeters. c) a data point chosen at random is as likely to be above the mean as it is to be below the mean. d) every height within three standard deviations of the mean is equally likely to be chosen if a data point is selected at random.
Answers: 2
question
Mathematics, 21.06.2019 23:30
Without multiplying, tell which product is larger and why. 5 × 1/3 or 5 × 2/3 a)5 × 1/3 because 1/3 is less than 2/3 b) 5 × 1/3 because 1/3 is greater than 2/3 c) 5 × 2/3 because 1/3 is less than 23 d) 5 × 23 because 1/3 is greater than 2/3
Answers: 1
You know the right answer?
PLEASE HELP

Plot the S ordered pairs from the table
on the coordinate plane.
Questions
question
English, 25.07.2020 01:01