
Mathematics, 30.03.2020 23:21 val186
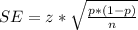
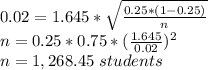
Uppose you want to estimate the proportion of traditional college students on your campus who own their own car. From research on other college campuses, you believe the proportion will be near 25%. What sample size is needed if you wish to be 95% confident that your estimate is within 0.02 of the true proportion?

Answers: 3


Another question on Mathematics
Mathematics, 21.06.2019 18:30
In right ∆abc shown below, the midpoint of hypotenuse ac is located at d and segment bd is drawn.if ab = 12 and bc = 16, then explain why bd = 10. hint: consider what you know about the diagonals of a rectangle.
Answers: 2
Mathematics, 21.06.2019 22:00
Question 13 (1 point) jerome is starting a new job. his contract states he will earn $42,000 the first year, and will get a 4% raise per year. which function s(x) represents jerome's salary after a certain number of years, x?
Answers: 1
Mathematics, 22.06.2019 02:30
Atrain traveled for 1.5 hours to the first station, stopped for 30 minutes, then traveled for 4 hours to the final station where it stopped for 1 hour. the total distance traveled is a function of time. which graph most accurately represents this scenario? a graph is shown with the x-axis labeled time (in hours) and the y-axis labeled total distance (in miles). the line begins at the origin and moves upward for 1.5 hours. the line then continues upward at a slow rate until 2 hours. from 2 to 6 hours, the line continues quickly upward. from 6 to 7 hours, it moves downward until it touches the x-axis a graph is shown with the axis labeled time (in hours) and the y axis labeled total distance (in miles). a line is shown beginning at the origin. the line moves upward until 1.5 hours, then is a horizontal line until 2 hours. the line moves quickly upward again until 6 hours, and then is horizontal until 7 hours a graph is shown with the axis labeled time (in hours) and the y-axis labeled total distance (in miles). the line begins at the y-axis where y equals 125. it is horizontal until 1.5 hours, then moves downward until 2 hours where it touches the x-axis. the line moves upward until 6 hours and then moves downward until 7 hours where it touches the x-axis a graph is shown with the axis labeled time (in hours) and the y-axis labeled total distance (in miles). the line begins at y equals 125 and is horizontal for 1.5 hours. the line moves downward until 2 hours, then back up until 5.5 hours. the line is horizontal from 5.5 to 7 hours
Answers: 1
Mathematics, 22.06.2019 06:30
Quickly select all numbers that are prime. 21 / 23 / 11 / 17 / 15
Answers: 1
You know the right answer?
Uppose you want to estimate the proportion of traditional college students on your campus who own th...
Questions


English, 20.04.2020 19:45
Mathematics, 20.04.2020 19:45
English, 20.04.2020 19:45

Computers and Technology, 20.04.2020 19:45
Mathematics, 20.04.2020 19:45

English, 20.04.2020 19:45
History, 20.04.2020 19:45

Social Studies, 20.04.2020 19:45
History, 20.04.2020 19:46


