subject
Mathematics, 27.03.2020 23:36 ptrlvn01

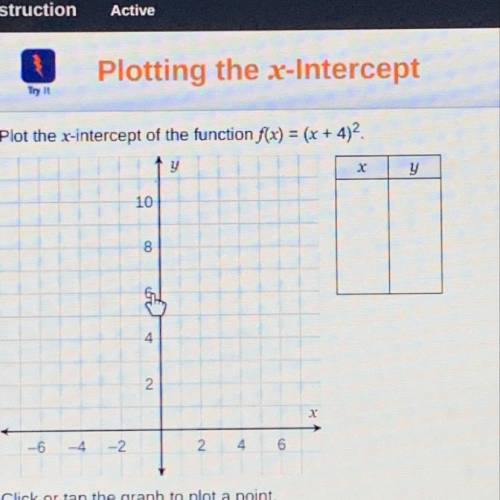
Plot the x-intercept of the function f(x) = (x + 4)2.
10
8
-6
-4
--2
46
Click or tap the graph to plot a point.


Plot the x-intercept of the function f(x) = (x + 4)2. 10 8 -6 -4 --2 46 Click or tap the graph to pl

ansver
Answers: 3

Another question on Mathematics

question
Mathematics, 21.06.2019 17:00
Tom had a total of $220 and he spent $35 on a basketball ticket . what percent of his money did he have left?
Answers: 1
question
Mathematics, 21.06.2019 17:30
F(x)= 4x g(x) =x-1 what is f(x) divided by g(x)
Answers: 2
question
Mathematics, 21.06.2019 17:40
Solve the given system of equations. 2y= -x+9 , 3x-6= -15
Answers: 2
question
Mathematics, 22.06.2019 00:30
What is the mean of the data set 125, 141, 213, 155, 281
Answers: 2
You know the right answer?
Plot the x-intercept of the function f(x) = (x + 4)2.
10
8
-6
-4
--2
Questions
question
Arts, 01.10.2019 09:00
question
History, 01.10.2019 09:00
question
Mathematics, 01.10.2019 09:00