
Mathematics, 24.03.2020 17:56 ggjhuvth
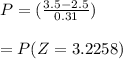
Rolling blackouts have become a way of life in many major cities around the world. With electrical demand far outstripping production, grid operators have come to rely on this systematic means of keeping the distribution system from experiencing complete failure. In one city, the blackout schedule has each region without power on average 2.5 hours per day. The standard deviation of blackout times in this city is 0.31 hours. A local hospital in the area purchases a generator that will provide power to nonessential systems for 3.5 hours. If the blackout times follow a normal distribution, what percentage of time will the hospital find themselves without power to these nonessential systems

Answers: 1

![[NORMSDIST(3.2258)]\\\\= 0.9994\\\\= 94.99%](/tpl/images/0561/0121/0b159.png)


Another question on Mathematics
Mathematics, 21.06.2019 16:00
Acircle has a diameter will endpoints of (-2,8) and (6, 4). what is the center of the circle
Answers: 1
Mathematics, 21.06.2019 18:00
Look at arnold's attempt to solve the equation for b: 3b = 12 b = 3 · 12 b = 36 describe the mistake that arnold made.
Answers: 2
Mathematics, 21.06.2019 19:00
This task builds on important concepts you've learned in this unit and allows you to apply those concepts to a variety of situations. the task has several parts, each in its own section. mr. hill's seventh grade math class has been learning about random sampling and how it tends to produce samples that are representative of an entire population. they've also learned that if a sample is representative of the entire population, then estimates or predictions made based on the sample usually apply to the population as well. today, in class, they are also learning about variation in random sampling. that, although predictions and estimates about the population can be made from a random sample, different random samples will often produce slightly different predictions or estimates. to demonstrate this concept to his students, mr. hill is going to use simulation. he begins the lesson by explaining to the class that a certain university in the united states has a student enrollment of 19,100. mr. hill knows the percentage of students that are male and the percentage of students that are female. using simulation and random sampling, he wants his seventh grade students to estimate both the percentage of male students and the number of male students that are enrolled in this university. to conduct the simulation, mr. hill has placed one hundred colored chips in a bag, using the appropriate percentages of enrolled male and female university students. red chips represent males, and yellow chips represent females. each seventh grade student will randomly select twenty chips, record the colors they selected, and put the chips back in the bag. at this point, each seventh grade student will only know the results of their own random sample. before you begin, it's a good idea to look over each part to get oriented to the whole task. additionally, it's best to complete the sections in order, since they build on each other. finally, the work you complete will be a combination of computer-graded problems and written work that your teacher will grade. in some cases, you will need to complete work outside of the problem (in a word processing document or on paper, for example) and upload it for grading. to get started click work on questions. questions: 1. suppose a student reaches in the bag and randomly selects nine red chips and eleven yellow chips. based on this sample, what is a good estimate for the percentage of enrolled university students that are male? 2. suppose a student reaches in the bag and randomly selects nine red chips and eleven yellow chips. based on this sample, what is a good estimate for the number of enrolled university students that are male? 3. suppose a different student reaches in the bag, randomly selects their twenty chips, and estimates that 60% of the students are male. how many yellow chips were in their sample? 4. suppose a different student reaches in the bag, randomly selects their twenty chips, and estimates that 60% of the students are male. based on this sample, what is a good estimate for the number of enrolled university students that are female? 5. based on your dot plot, make a new estimate of both the percentage and number of males that attend this university. use complete sentences in your answer and explain your reasoning. 6. compare your estimates for the percentage of male university students from part a and part b. which estimate do you think is more representative of the population? use complete sentences in your answer and explain your reasoning. 7. once you have created both sets of numbers, complete the following tasks. in each task, make sure to clearly label which set you are identifying or describing. identify the elements of each set that you created. calculate the mean of each set. show your work in your answer. calculate the mean absolute deviation of each set. show your work in your answer. describe the process you used to create your sets of numbers under the given conditions.
Answers: 1
Mathematics, 21.06.2019 19:30
[15 points]find the least common multiple of the expressions: 1. 3x^2, 6x - 18 2. 5x, 5x(x +2) 3. x^2 - 9, x + 3 4. x^2 - 3x - 10, x + 2 explain if possible
Answers: 3
You know the right answer?
Rolling blackouts have become a way of life in many major cities around the world. With electrical d...
Questions

History, 17.11.2020 14:00
Mathematics, 17.11.2020 14:00
History, 17.11.2020 14:00

Business, 17.11.2020 14:00

Arts, 17.11.2020 14:00
Mathematics, 17.11.2020 14:00
Mathematics, 17.11.2020 14:00
Mathematics, 17.11.2020 14:00

Chemistry, 17.11.2020 14:00
Mathematics, 17.11.2020 14:00
Mathematics, 17.11.2020 14:00
Mathematics, 17.11.2020 14:00
Mathematics, 17.11.2020 14:00
Arts, 17.11.2020 14:00

English, 17.11.2020 14:00
Chemistry, 17.11.2020 14:00
Mathematics, 17.11.2020 14:00
Mathematics, 17.11.2020 14:00


