
Mathematics, 23.03.2020 17:58 mamasmontoya
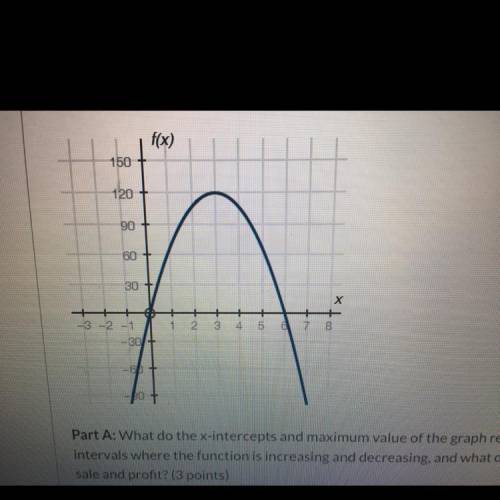
The graph below shows a company's profit f(x), in dollars, depending on the price of pens x, in
dollars, being sold by the company:
Part A: What do the x-intercepts and maximum value of the graph represent? What are the
intervals where the function is increasing and decreasing, and what do they represent about the
sale and profit?
Part B: What is an approximate average rate of change of the graph from x = 3 to x =5, and what
does this rate represent?
Please help

Answers: 1


Another question on Mathematics
Mathematics, 21.06.2019 21:00
Rewrite the following quadratic functions in intercept or factored form. show your work. y = x^2 + 7x + 10
Answers: 2
Mathematics, 21.06.2019 21:30
80 points suppose marcy made 45 posts online. if 23 of them contained an image, what percent of her posts had images? round your answer to the nearest whole percent. 54 percent 51 percent 49 percent 48 percent
Answers: 2
Mathematics, 21.06.2019 22:00
Melanie is buying a bathing suit that costs 39.99. she is given a discount at the cash register of $6.00 when she scratched 15% off on a game piece for a store promotion. what will the sale price of melanie’s bathing suit be?
Answers: 1
You know the right answer?
The graph below shows a company's profit f(x), in dollars, depending on the price of pens x, in
Questions

Computers and Technology, 12.11.2020 23:00
Mathematics, 12.11.2020 23:00

Mathematics, 12.11.2020 23:00


Advanced Placement (AP), 12.11.2020 23:00
Mathematics, 12.11.2020 23:00

Mathematics, 12.11.2020 23:00

World Languages, 12.11.2020 23:00
Physics, 12.11.2020 23:00

Mathematics, 12.11.2020 23:00


