
Complete each of the following.
a. Graph each function by making a table of values.
b. D...

Mathematics, 20.03.2020 22:40 kaylatunell123
Complete each of the following.
a. Graph each function by making a table of values.
b. Determine the consecutive values of x between which each real zero is located.
c. Estimate the x-coordinates at which the relative maxima and minima occur.
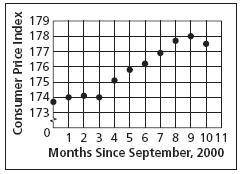
PRICES The Consumer Price Index (CPI) gives the relative price for a fixed set of goods and services. The CPI from September 2000 to July 2001 is shown in the graph.
Source: U. S. Bureau of Labor Statistics
a. Describe the turning points of the graph.
b. If the graph were modeled by a polynomial equation, what is the least degree the equation could have?

Answers: 2


Another question on Mathematics
Mathematics, 21.06.2019 15:30
Find the slope of the line below . enter your answer as a fraction or decimal. use a slash mark ( / ) as the fraction bar if necessary
Answers: 3
Mathematics, 21.06.2019 16:30
How to choose the sign of the radical in the denominator of the formula for the distance from a point to a line.
Answers: 2
Mathematics, 21.06.2019 20:10
60 2(x + 2) in the diagram, gef and hef are congruent. what is the value of x?
Answers: 2
You know the right answer?
Questions

Business, 09.11.2020 17:20
Mathematics, 09.11.2020 17:20


Physics, 09.11.2020 17:20

English, 09.11.2020 17:20
Mathematics, 09.11.2020 17:20
Mathematics, 09.11.2020 17:20

Mathematics, 09.11.2020 17:20


