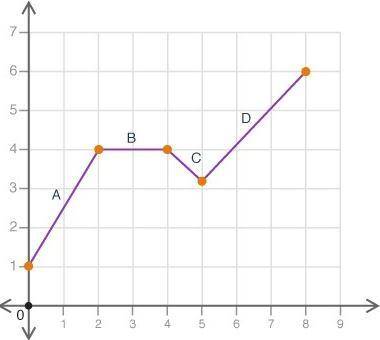
Which of the following best describes interval C on the graph shown?
A coordinate plane...

Mathematics, 19.03.2020 16:33 yakshp4098
Which of the following best describes interval C on the graph shown?
A coordinate plane is shown. The line increases from x equals 0 to 2, then is horizontal from 2 to 4, decreases from 4 to 5, and then increases from 5 to 8.
Linear constant
Linear decreasing
Linear increasing
Nonlinear increasing

Answers: 2


Another question on Mathematics
Mathematics, 21.06.2019 17:30
Which of the following tables represents exponential functions?
Answers: 1
Mathematics, 21.06.2019 19:00
Thee blue triangle has rotated from quadrant i to quadrant iii about the origin. describe the effects of the rotation on the coordinates of the blue triangle.
Answers: 3
Mathematics, 21.06.2019 20:30
What is the length of the segment, endpoints of which are intersections of parabolas y=x2? 11 4 x? 7 4 and y=? 7 8 x2+x+ 31 8 ?
Answers: 2
You know the right answer?
Questions

Physics, 03.12.2021 01:00

Social Studies, 03.12.2021 01:00
Mathematics, 03.12.2021 01:00
Mathematics, 03.12.2021 01:00
Social Studies, 03.12.2021 01:00

History, 03.12.2021 01:00
Social Studies, 03.12.2021 01:00
Social Studies, 03.12.2021 01:00

Chemistry, 03.12.2021 01:00
History, 03.12.2021 01:00
Chemistry, 03.12.2021 01:00

Mathematics, 03.12.2021 01:00

Computers and Technology, 03.12.2021 01:00
Mathematics, 03.12.2021 01:00


