Name
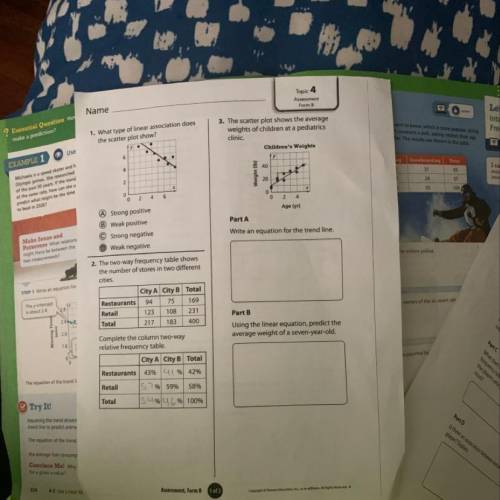
What type of linear association
the scatter plot show?
The Karter plot shows...

Mathematics, 18.03.2020 17:54 landonp101
Name
What type of linear association
the scatter plot show?
The Karter plot shows the average
weights of children at a pediatrics
dinic
C ross Weight
We
Age ty
Part A
Write an equation for the trend line.
A Strong positive
® Weak positive
© Strong negative
Weak negative
2. The two-way frequency table shows
the number of stores in two different
cities
City A City B Total
Restaurants 94 75 169
Retail
123 108231
Total 217 183 400
Part B
Using the linear equation, predict the
average weight of a seven-year-old.
Complete the column two-way
relative frequency table.
City A City B Total
Restaurants 43% 41% 42
Retail 197% 59% 58%
Total 154906% 100%
Assessment, Form B
1082

Answers: 2


Another question on Mathematics
Mathematics, 21.06.2019 15:00
Find parametric equations for the line tangent to the curve of intersection of the surfaces at the given point. surfaces: xsquared2plus+2yplus+2zequals=1212 yequals=33 point: left parenthesis 1 comma 3 comma five halves right parenthesis
Answers: 1
Mathematics, 21.06.2019 20:00
The rectangle shown has a perimeter of 108 cm and the given area. its length is 6 more than five times its width. write and solve a system of equations to find the dimensions of the rectangle.
Answers: 3
Mathematics, 21.06.2019 20:20
Recall that the owner of a local health food store recently started a new ad campaign to attract more business and wants to know if average daily sales have increased. historically average daily sales were approximately $2,700. the upper bound of the 95% range of likely sample means for this one-sided test is approximately $2,843.44. if the owner took a random sample of forty-five days and found that daily average sales were now $2,984, what can she conclude at the 95% confidence level?
Answers: 1
Mathematics, 21.06.2019 21:00
Ariana starts with 100 milligrams of a radioactive substance. the amount of the substance decreases by 20% each week for a number of weeks, w. the expression 100(1−0.2)w finds the amount of radioactive substance remaining after w weeks. which statement about this expression is true? a) it is the difference between the initial amount and the percent decrease. b) it is the difference between the initial amount and the decay factor after w weeks. c) it is the initial amount raised to the decay factor after w weeks. d) it is the product of the initial amount and the decay factor after w weeks.
Answers: 1
You know the right answer?
Questions


History, 07.12.2020 02:10

Social Studies, 07.12.2020 02:10

English, 07.12.2020 02:10

Mathematics, 07.12.2020 02:10
Mathematics, 07.12.2020 02:10
English, 07.12.2020 02:10
Mathematics, 07.12.2020 02:10
English, 07.12.2020 02:10


