is

Mathematics, 17.03.2020 01:37 xojade
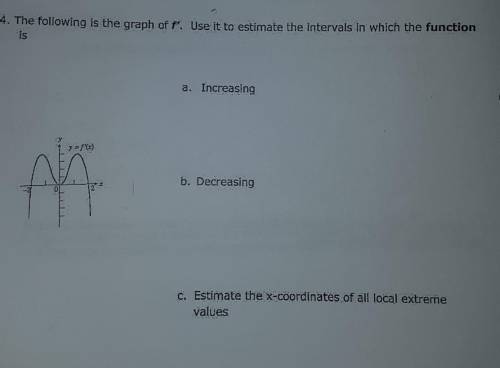
The following is the graph of f'. Use it to estimate the intervals in which the function
is
a. Increasing
b. Decreasing
c. Estimate the x-coordinates of all local extreme
values

Answers: 1


Another question on Mathematics
Mathematics, 20.06.2019 18:04
Working on itts i’m going to need you to me as i go along 1-5
Answers: 1
Mathematics, 21.06.2019 12:30
Which statements are true of the graph of h(x) = ^3 square root of x-4 ? check all that apply.the domain of h(x) is the set of all real numbers. the range of h(x) is the set of all real numbers. for all points (x, h( h(x) exists if and only if x – 4 0. the graph of h(x) is a translation of f(x) down 4 units. the graph of h(x) intercepts the x-axis at (4, 0).
Answers: 1
Mathematics, 21.06.2019 17:40
Solve the given system of equations. 2y= -x+9 , 3x-6= -15
Answers: 2
Mathematics, 21.06.2019 19:30
The position of a moving particle is given by the position function: f(t)=-9t-t^2-0.2t^3+0.1t^4 a. at what time does the particle reverse direction? b. when is the displacement positive? (round one decimal place and answer in interval notation) c. when is the displacement negative? (round one decimal place and answer in interval notation) d. when is the particle’s acceleration positive? (round one decimal place and answer in interval notation) e. when is the particle’s acceleration negative? (round one decimal place and answer in interval notation)
Answers: 3
You know the right answer?
The following is the graph of f'. Use it to estimate the intervals in which the function
is
is
Questions


Chemistry, 20.05.2021 03:40
Mathematics, 20.05.2021 03:40
Mathematics, 20.05.2021 03:40

English, 20.05.2021 03:40

Social Studies, 20.05.2021 03:40

Mathematics, 20.05.2021 03:40
History, 20.05.2021 03:40


Mathematics, 20.05.2021 03:50


