
Mathematics, 13.03.2020 22:04 jamaicalove2880
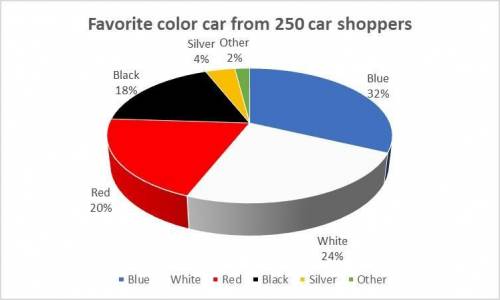
1. A researcher collected data from car shoppers about their favorite car color. He asked 250 people about their favorite vehicle color and the survey revealed the following: 32% said blue, 24% said white, 20% said red, 18% said black, and 4% said silver.
(a) What percent preferred a color other than blue, white, red, black, or silver?
(3 pts: 2 for answer, 1 for showing work)
(b) How many more people said their favorite color is white compared to those who said black? (3 pts – 2 for answer, 1 for showing work)
(c) Draw and label a circle graph showing the responses to the survey. Be sure to include a section for “Other”. Be sure your circle graph is labeled, and the percentages are in proportion to the whole. (2 pts – 1 for correctly showing percentages and 1 for labeling)

Answers: 2


Another question on Mathematics
Mathematics, 21.06.2019 14:20
If sin θ=24/25 and 0 less than or equal to θ less than or equal to π/2, find the exact value of tan 2θ. answers; a) -527/336 b) -336/527 c)7/24 d) 24/7
Answers: 3
Mathematics, 21.06.2019 17:30
Which of the following is correct interpretation of the expression -4+13
Answers: 2
Mathematics, 21.06.2019 21:00
George is putting trim around his rectangular deck, including the gate. he will need 44 feet of trim to do the entire deck. if the deck is 13 feet long, how wide is the deck?
Answers: 2
Mathematics, 21.06.2019 21:30
Joanie wrote a letter that was 1 1/4 pages long. katie wrote a letter that was 3/4 page shorter then joagies letter. how long was katies letter
Answers: 1
You know the right answer?
1. A researcher collected data from car shoppers about their favorite car color. He asked 250 people...
Questions

History, 05.02.2020 01:59


Mathematics, 05.02.2020 01:59
History, 05.02.2020 01:59

Social Studies, 05.02.2020 01:59
English, 05.02.2020 01:59

Physics, 05.02.2020 01:59


