
Mathematics, 11.03.2020 04:37 Homepage10
A researcher, using data on class size (CS) and average test scores (ATS) from 100 third grade classes, estimate the OLS regression ATS = 520.4 - 5.82 times CS, R^2 = 0.8, SER = 11.5
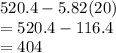
a) Suppose a classroom has 20 students. What is the regression's prediction for that classroom's average test score?
(b) Last year a classroom had 19 students, and this year it has 21 students. What is the regression's prediction for the change in the classroom average test score?
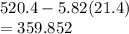
(c) The sample average class size across the 100 classrooms is 21.4 What is the sample average of the test scores across the 100 classrooms?
(d) What is the sample standard deviation of the test scores across the 100 classrooms?

Answers: 1


Another question on Mathematics
Mathematics, 21.06.2019 17:50
Graph y ≥ -x^2 - 1. click on the graph until the correct graph appears.
Answers: 1
Mathematics, 21.06.2019 22:50
Which of the following is closest to 32.9 x 7.5? a: 232 b: 259 c: 220 d: 265
Answers: 2
Mathematics, 22.06.2019 00:00
The statements below can be used to prove that the triangles are similar. ? △abc ~ △xyz by the sss similarity theorem. which mathematical statement is missing? ∠b ≅ ∠y ∠b ≅ ∠z
Answers: 3
You know the right answer?
A researcher, using data on class size (CS) and average test scores (ATS) from 100 third grade class...
Questions
Mathematics, 22.06.2021 17:00

History, 22.06.2021 17:00


World Languages, 22.06.2021 17:00
Mathematics, 22.06.2021 17:00

Mathematics, 22.06.2021 17:00

Mathematics, 22.06.2021 17:00


