![r=\frac{n(\sum xy)-(\sum x)(\sum y)}{\sqrt{[n\sum x^2 -(\sum x)^2][n\sum y^2 -(\sum y)^2]}}](/tpl/images/0541/2302/ec454.png)

![r=\frac{10(330.0321)-(75.81948)(43.5231)}{\sqrt{[10(574.8598) -(75.819)^2][10(192.8274) -(43.5231)^2]}}=0.989](/tpl/images/0541/2302/c7336.png)
![r=\frac{10(330.0321)-(75.81948)(43.5231)}{\sqrt{[10(574.8598) -(75.81948)^2][10(192.8274) -(43.5231)^2]}}=0.989](/tpl/images/0541/2302/07d17.png)
The number of motor vehicles registered in millions in the US has grown as follows:
Year...

Mathematics, 10.03.2020 18:56 tysongraham5232
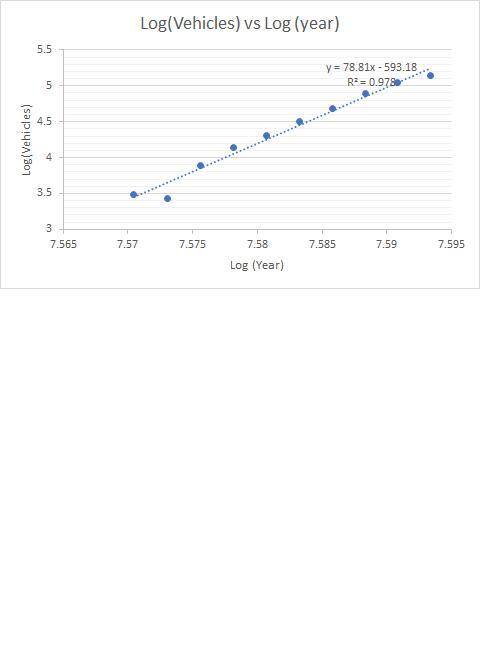
The number of motor vehicles registered in millions in the US has grown as follows:
Year: 1940, 1945 1950, 1955, 1960, 1965, 1970, 1975, 1980, 1985
Vehicles: 32.4, 31.0, 49.2, 62.7, 73.9, 90.4, 108.4, 132.9, 155.8, 171.7
(Where Year = X and Vehicles = Y)
Use logarithms to transform the data into a linear association. White the equation of the LSRL. Your answer should have logs in it. Remember to define any variables.
a. Present a scatter plot for the data. (Hint: let x = 0 represent the year 1940)
b. Determine the correlation coefficient for the data and interpret the value.

Answers: 3


Another question on Mathematics
Mathematics, 22.06.2019 01:00
Which of the following domains provide a real value periods
Answers: 3
Mathematics, 22.06.2019 04:00
Miguel has one foot of string. he cuts the string into fourths. how many inches is each piece of string?
Answers: 1
You know the right answer?
Questions


History, 31.01.2020 17:50


Geography, 31.01.2020 17:50
Mathematics, 31.01.2020 17:50

Biology, 31.01.2020 17:50
Mathematics, 31.01.2020 17:50

English, 31.01.2020 17:50
History, 31.01.2020 17:50
Mathematics, 31.01.2020 17:50
History, 31.01.2020 17:50


