
Mathematics, 10.03.2020 18:30 dedrell16
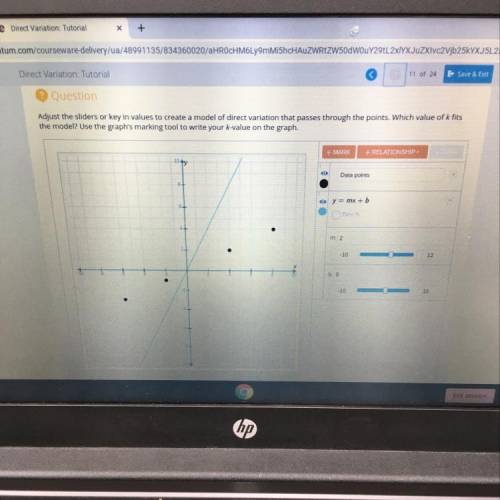
Adjust the sliders or key in values to create a model of direct variation that passes through the points. Which value of k fits
the model? Use the graph's marking tool to write your k-value on the graph.
+ MARK
+ RELATIONSHIP
10+
Data points
o
y = mx + b
m: 2
-10
-
b: 0
-10
Ext session
9:49

Answers: 2


Another question on Mathematics
Mathematics, 21.06.2019 16:50
Suppose that the price p (in dollars) and the weekly sales x (in thousands of units) of a certain commodity satisfy the demand equation 4p cubedplusx squaredequals38 comma 400. determine the rate at which sales are changing at a time when xequals80, pequals20, and the price is falling at the rate of $.20 per week.
Answers: 3
Mathematics, 21.06.2019 23:30
When a valve is open 281 gallons of water go through it in one hour the number of gallons that would go through in 94 hours is
Answers: 1
You know the right answer?
Adjust the sliders or key in values to create a model of direct variation that passes through the po...
Questions


Mathematics, 26.08.2021 17:20
Physics, 26.08.2021 17:20

History, 26.08.2021 17:20
History, 26.08.2021 17:20
Mathematics, 26.08.2021 17:20
Mathematics, 26.08.2021 17:20

Biology, 26.08.2021 17:20

Social Studies, 26.08.2021 17:20

Mathematics, 26.08.2021 17:20
History, 26.08.2021 17:20
Mathematics, 26.08.2021 17:20
Mathematics, 26.08.2021 17:20


