QUESTION 1:
Male and female high school students reported how many hours they worked each week...

Mathematics, 07.03.2020 04:44 BigDaddy1220
QUESTION 1:
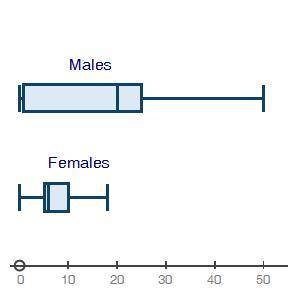
Male and female high school students reported how many hours they worked each week in summer jobs. The data are represented in the following box plots:
Identify any values of data that might affect the statistical measures of spread and center.
A. The females worked less than the males, and the female median is close to Q1.
B. There is a high data value that causes the data set to be asymmetrical for the males.
C. There are significant outliers at the high ends of both the males and the females.
D. Both graphs have the required quartiles.
QUESTION 2:
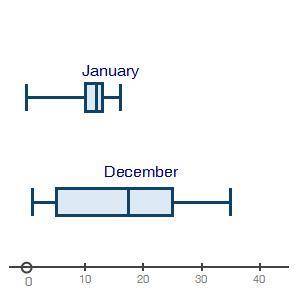
The box plots below show the average daily temperatures in January and December for a U. S. city:
What can you tell about the means for these two months?
A. the mean for December is higher than January's mean.
B. It is almost certain that January's mean is higher.
C. There is no way of telling what the means are.
D. The narrow IQR for January causes its mean to be lower.
QUESTION 3:
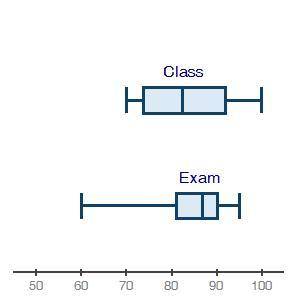
The box plots below show student grades on the most recent exam compared to overall grades in the class:
Which of the following best describes the information about the medians?
A. The exam outlier at 60 makes the IQR narrower and the median higher.
B. The class data is more evenly spread, which pulls its median down.
C. The class median is lower than the exam median.
D. The class Q3 is higher than the exam Q3.

Answers: 1


Another question on Mathematics
Mathematics, 21.06.2019 14:00
50 points! antonio made a scale model of a building. the model's scale is 1 inch to 235 feet and its height is 3.5 inches. what is the exact height of the actual building? enter your answer in the box.
Answers: 3
Mathematics, 21.06.2019 15:10
The green family is a family of six people. they have used 4,885.78 gallons of water so far this month. they cannot exceed 9,750.05 gallons per month during drought season. write an inequality to show how much water just one member of the family can use for the remainder of the month, assuming each family member uses the same amount of water every month.
Answers: 1
Mathematics, 21.06.2019 15:10
Julia chooses a card at random from her set of cards. what is the probability that the card is labeled cat or hamster?
Answers: 2
Mathematics, 21.06.2019 22:30
What is the approximate value of q in the equation below? –1.613–1.5220.5853.079
Answers: 1
You know the right answer?
Questions
Mathematics, 07.07.2020 04:01


History, 07.07.2020 04:01
Mathematics, 07.07.2020 04:01
Mathematics, 07.07.2020 04:01
Mathematics, 07.07.2020 04:01
Mathematics, 07.07.2020 04:01
Mathematics, 07.07.2020 04:01
Mathematics, 07.07.2020 04:01
Mathematics, 07.07.2020 04:01

History, 07.07.2020 04:01
Mathematics, 07.07.2020 04:01


