Mathematics, 25.02.2020 01:07 21ghostrider21
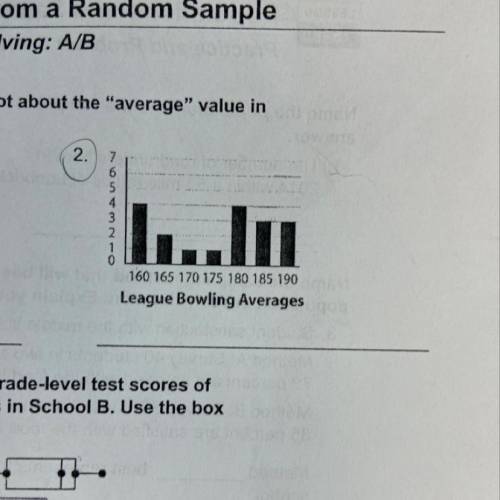
What can be inferred from each data plot about the "average" value in comparison to the other data ?


Answers: 3


Another question on Mathematics

Mathematics, 21.06.2019 19:40
The human resources manager at a company records the length, in hours, of one shift at work, x. he creates the probability distribution below. what is the probability that a worker chosen at random works at least 8 hours? probability distribution px(x) 6 hours 7 hours 8 hours 9 hours 10 hours 0.62 0.78 пол
Answers: 1

Mathematics, 21.06.2019 20:00
Michelle and julie work at a catering company. they need to bake 264 cookies for a birthday party that starts in a little over an hour and a half. each tube of cookie dough claims to make 36 cookies, but michelle eats about 1/5 of every tube and julie makes cookies that are 1.5 times as large as the recommended cookie size.it takes about 8 minutes to bake a container of cookies, but since julie's cookies are larger, they take 12 minutes to bake. a. how many tubes should each girl plan to bake? how long does each girl use the oven? b. explain your solution process what did you make? c. what assumptions did you make?
Answers: 2

Mathematics, 21.06.2019 20:30
The sum of these consecutive integers is equal to 9 less than 4 times the least of the integer. find the three integers
Answers: 1

Mathematics, 21.06.2019 21:30
The domain of a function can be represented by which one of the following options? o a. a set of output values o b. a set of f(x) values o c. a set of input values o d. a set of both input and output values
Answers: 3
You know the right answer?
What can be inferred from each data plot about the "average" value in comparison to the other data ?...
Questions


Mathematics, 08.12.2020 01:00

Physics, 08.12.2020 01:00

Geography, 08.12.2020 01:00

Mathematics, 08.12.2020 01:00


Mathematics, 08.12.2020 01:00


History, 08.12.2020 01:00


Social Studies, 08.12.2020 01:00


