
Mathematics, 24.02.2020 21:41 sandrafina2004
The following probabilities are based on data collected from U. S. adults. Individuals are placed into a weight category based on weight, height, gender and age.
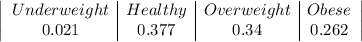
underweight healthy weight overweight (not obese) obese
Probability 0.021 0.377 0.34 0.262
Based on this data, what is the probability that a randomly selected U. S. adult is not underweight?
Your answer should be given to 3 decimal places, and please show work~

Answers: 2


Another question on Mathematics
Mathematics, 21.06.2019 19:30
At 6 1/2 cents per pound of string beans how much does 7 pounds cost
Answers: 1
Mathematics, 21.06.2019 20:00
Given ab and cb are tangents of p, and m =10°. what is the measure of abp?
Answers: 3
Mathematics, 22.06.2019 00:40
Compute the standard deviation of the following set of data to the nearest whole number. 10, 10, 15, 20, 25
Answers: 3
Mathematics, 22.06.2019 00:50
E. which of the following is not a possible probability? a. 25/100 b. 1.25 c. 1 d. 0
Answers: 1
You know the right answer?
The following probabilities are based on data collected from U. S. adults. Individuals are placed in...
Questions
Mathematics, 16.02.2021 22:50


Mathematics, 16.02.2021 22:50
Mathematics, 16.02.2021 22:50
History, 16.02.2021 22:50


English, 16.02.2021 22:50

Computers and Technology, 16.02.2021 22:50
Mathematics, 16.02.2021 22:50
Health, 16.02.2021 22:50
Biology, 16.02.2021 22:50


