
Mathematics, 14.10.2019 18:30 orose6395
Agroup of students were surveyed to find out if they like building snowmen or skiing as a winter activity. the results of the survey are shown below:
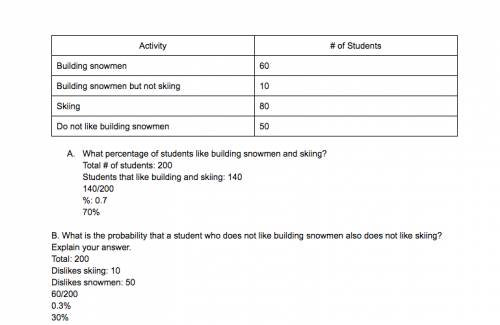
60 students like building snowmen
10 students like building snowmen but do not like skiing
80 students like skiing
50 students do not like building snowmen
make a two-way table to represent the data and use the table to answer the following questions.
part a: what percentage of the total students surveyed like both building snowmen and skiing? show your work. (5 points)
part b: what is the probability that a student who does not like building snowmen also does not like skiing? explain your answer. (5 points)

Answers: 3


Another question on Mathematics
Mathematics, 21.06.2019 17:00
The table below shows the height of a ball x seconds after being kicked. what values, rounded to the nearest whole number, complete the quadratic regression equation that models the data? f(x) = x2 + x + 0based on the regression equation and rounded to the nearest whole number, what is the estimated height after 0.25 seconds? feet
Answers: 2
Mathematics, 21.06.2019 19:10
Aline that intersects one of two parallel lines intersects the other also always sometimes never
Answers: 3
Mathematics, 21.06.2019 22:00
How do you write a paragraph proof to prove that the corresponding angles shown are congruent
Answers: 2
You know the right answer?
Agroup of students were surveyed to find out if they like building snowmen or skiing as a winter act...
Questions


Computers and Technology, 03.07.2021 04:30

Computers and Technology, 03.07.2021 04:30
Mathematics, 03.07.2021 04:40

Mathematics, 03.07.2021 04:40

Mathematics, 03.07.2021 04:40
Computers and Technology, 03.07.2021 04:40


