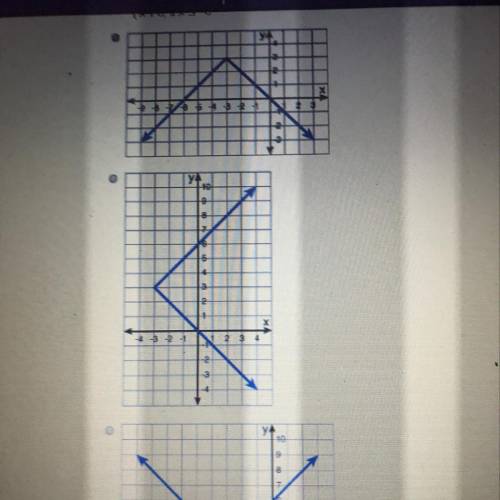
Which graph represents the function below?
s-x if x>-3
y = x+6, if xs-3
...

Mathematics, 18.02.2020 20:57 terribrady98
Which graph represents the function below?
s-x if x>-3
y = x+6, if xs-3

Answers: 1


Another question on Mathematics
Mathematics, 21.06.2019 14:50
(a) compute the maclaurin polynomial m2(x) for f(x) = cos x. (b) use the polynomial of part (a) to estimate cos π 12. (c) use a calculator to compute the error made using the estimate from part (b) for the value of cos π 12. remember that the error is defined to be the absolute value of the difference between the true value and the estimate.
Answers: 2
Mathematics, 21.06.2019 19:00
How can you tell when x and y are not directly proportional?
Answers: 1
Mathematics, 21.06.2019 19:40
What is the range of the function? f(x)=-2|x+1|? a. all real numbers. b. all real numbers less than or equal to 0. c. all real numbers less than or equal to 1. d. all real numbers greater than or equal to 1
Answers: 2
You know the right answer?
Questions


English, 28.09.2019 10:50


Biology, 28.09.2019 10:50
Mathematics, 28.09.2019 10:50


