
Mathematics, 15.02.2020 01:22 Daniah2206
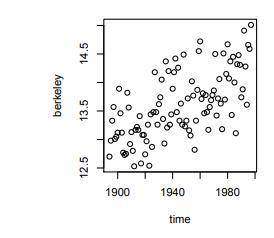
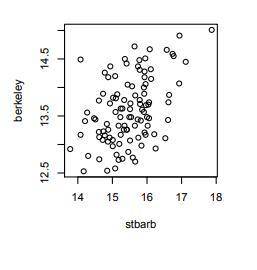
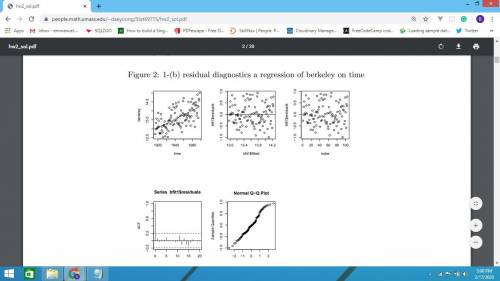
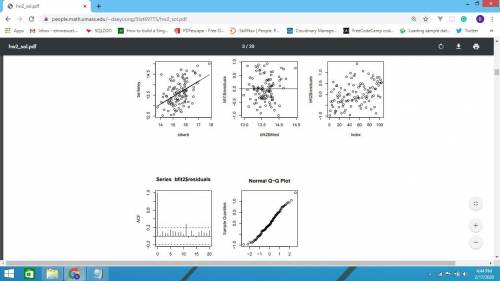
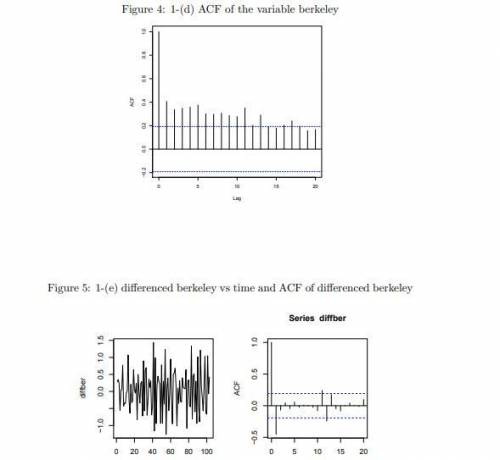
The file "berkeley. dat" contains average yearly temperatures for the cities of Berkeleyand Santa Barbara. Import the data into R using the following commandsberk<-scan("berkeley. dat", what=list(double(0),double(0),doubl e(0)))time<-berk[[1]]berkeley< ;-berk[[2]]stbarb<-berk[[3]](a) Plot the . Also, plotberkeleyversusstbarb.(b) Perform a regression ofberkeleyontime. What do you think about this fit? Besure to make diagnostic plots (including ACF) of the residuals. If there are anyviolations of the assumptions for a linear regression model, make sure to commenton them.(c) Perform a regression ofberkeleyonstbarb. Comment on the fit and the resid-uals.(d) Make a time series plot of the variableberkeleyand an ACF plot of the data. Does the time series appear to be stationary? Explain. Interpret the ACF plotin this situation.(e) Difference the data. The commanddiff(berkeley)will produce the differenceddata. Plot this differenced data, and make an ACF plot. What is your opinion ofwhether the series is stationary after differencing?(f) Now, we have detrended this series by using linear regression and with differenc-ing. The result of detrending via regression was a model that fit rather well andresiduals that had no apparent dependency. Let us assume then that the truemodel for this data isxt=β1+β2t+wt4
wherewt, t= 1, ..., Tis Gaussian white noise with varianceσ2w. (This is the sameas assuming that this data follows the standard regression assumptions.) Assum-ing this model, describe the model (i. e. write out a formula) for the differencedtime series,∇xt. Use this to explain the apparent dependency in the differenceddata from 1e above

Answers: 1


Another question on Mathematics
Mathematics, 21.06.2019 13:30
∠1 and ∠2 are complementary. ∠1=x°∠2=(3x+30)° select from the drop down menu to correctly answer the question. what is the value of x? . a.15 b.25 c.30 d.40 e.55
Answers: 1
Mathematics, 21.06.2019 19:10
Girardo is using the model below to solve the equation . girardo uses the following steps: step 1 add 4 negative x-tiles to both sides step 2 add 1 negative unit tile to both sides step 3 the solution is which step could be adjusted so that gerardo's final step results in a positive x-value? in step 1, he should have added 4 positive x-tiles to both sides. in step 1, he should have added 3 negative x-tiles to both sides. in step 2, he should have added 4 negative unit tiles to both sides. in step 2, he should have added 1 positive unit tile to both sides.
Answers: 2
Mathematics, 21.06.2019 19:30
What is the effect on the graph of the function f(x)=x when f(x) is replaced with -f(x)+4
Answers: 1
Mathematics, 22.06.2019 00:30
Will mark ! (10 points also! ) if x varies inversely with y and x =6 when y= 10, find y when x=8 a. y=4.8 b. y=7.5 c. y=40/3 d. y=4/15
Answers: 1
You know the right answer?
The file "berkeley. dat" contains average yearly temperatures for the cities of Berkeleyand Santa Ba...
Questions

Mathematics, 18.02.2021 20:20
Mathematics, 18.02.2021 20:20
Mathematics, 18.02.2021 20:20
Mathematics, 18.02.2021 20:20


Mathematics, 18.02.2021 20:20

Biology, 18.02.2021 20:20
English, 18.02.2021 20:20

Arts, 18.02.2021 20:20
Mathematics, 18.02.2021 20:20
Mathematics, 18.02.2021 20:20


